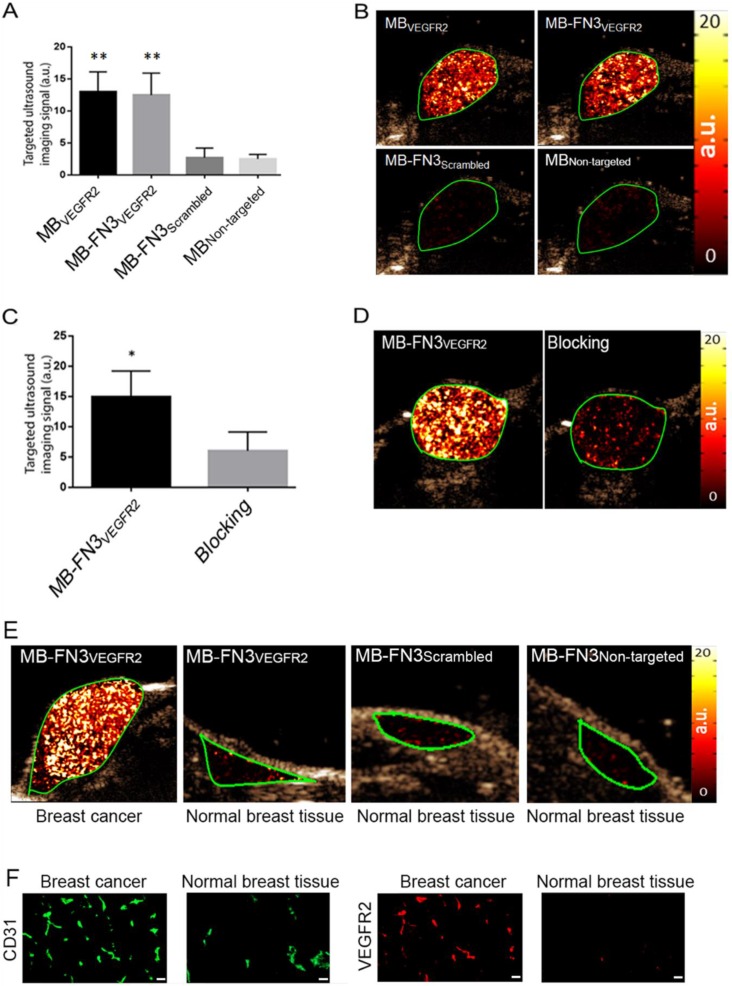
Figure 5.
In vivo USMI of breast cancer in transgenic mouse model. A, bar graph summarizes in vivo imaging signal using the various types of contrast MB. Error bar = standard deviation; **, P < 0.01. B, representative transverse contrast mode ultrasound images show strong signal in breast cancer (green ROI) after injection of MBVEGR2 and MB-FN3VEGFR2 but only background signal following injection of the two types of control MBs (MB-FN3Scrambled and MBNon-targeted). C and D, bar graph and representative in vivo USMI example show substantial decrease of imaging signal after intravenous administration of free blocking FN3VEGFR2 ligand. Error bar = standard deviation; *, P < 0.05. E, representative transverse contrast mode ultrasound images show a strong signal in breast cancer but only background signal in control normal mammary gland tissue after injection of MB-FN3VEGFR2, MB-FN3Scrambled, and MBNon-targeted. F, representative immunofluorescence staining of breast cancer and normal mammary tissue shows strong expression of VEGFR2 on the neovasculature of cancer (co-localization of VEGFR2 (red) on CD31-stained (green) tumor vessels) compared to normal control tissue. Scale bar = 50 µm.

