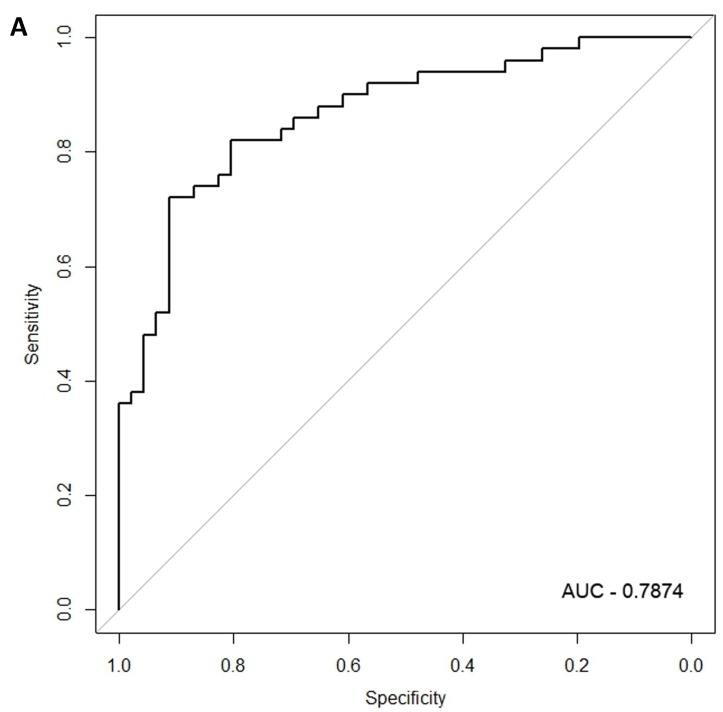
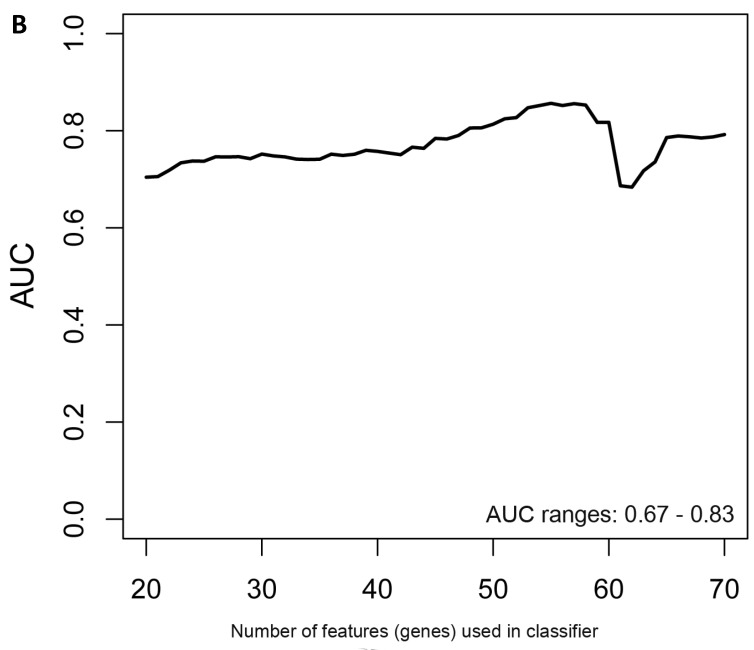
Figure 2.
Class comparison of female symptomatic V30M TTR FAP patients and asymptomatic V30M carriers. (a) ROC curve for symptomatic vs. asymptomatic FAP female subjects using an SVM “locked” best model comprised of 80 genes and 500 bootstrap iterations with sensitivity, specificity, PPV and NPV of 76%, 80%, 81% and 75%, respectively. (b) The Harrell bootstrapping plot of the “bias-corrected” AUCs for female specific classifiers of different feature sizes (20-70) using a logistic regression model. The results again show that models with >50 genes/features give AUCs >80%.


