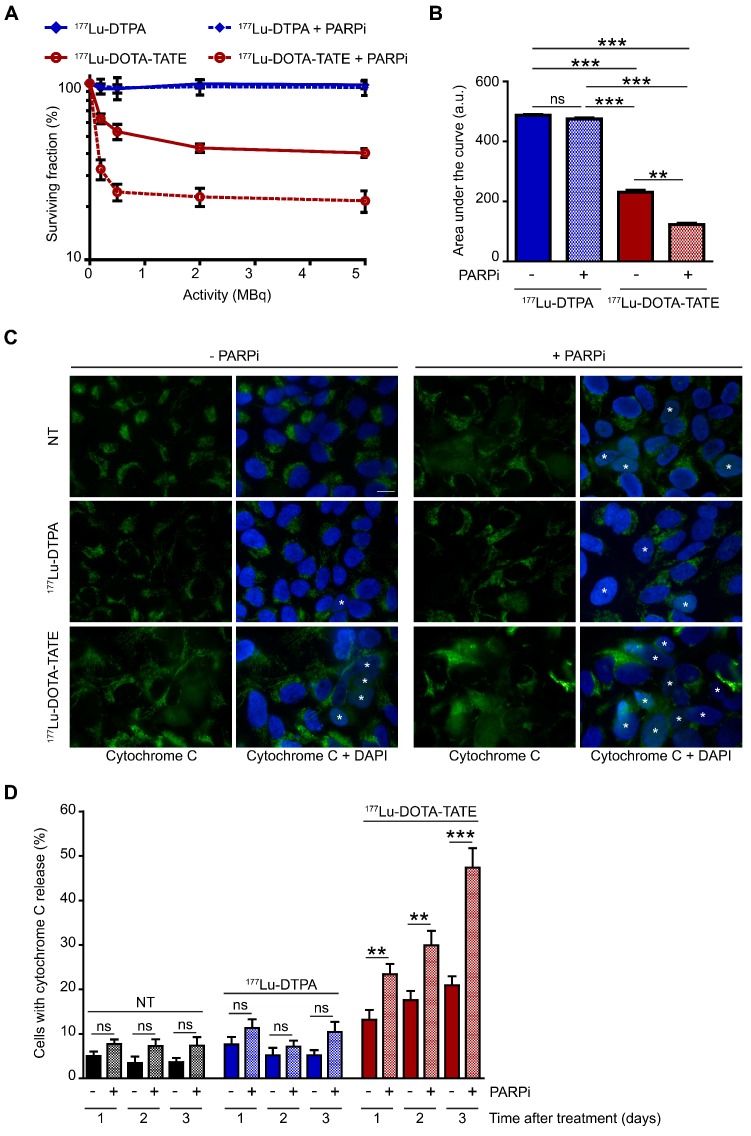
Figure 3.
Effect of PARP inhibition on PRRT induced cell death.(A) Colony forming ability of cells after different activity quantities of PRRT (177Lu-DTPA or 177Lu-DOTA-TATE) and afterwards treated or not with PARP inhibitor (PARPi). The percentage of surviving cells was plotted against the applied PRRT activity, measured by counting surviving colonies of two independent experiments. Error bars indicate the SEM. (B) Area under the curve comparison from the data in panel 3A. Statistics: not significant (ns), ** p<0.01 and *** p<0.001. (C) Immunofluorescent cytochrome C (green) and DAPI (blue) staining of a field of cells 3 days after treatment. Cells with released cytochrome C were are marked with an asterisk. Cells were non-treated (NT), treated with 177Lu-DTPA or with 177Lu-DOTA-TATE and afterwards treated or not with PARPi. Scale bar = 15 μm. (C) Quantification of the number of cells with released cytochrome C at 1, 2 and 3 days after treatment. 8 microscope fields with on average 17 cells per field were quantified. Error bars represent the SEM. Statistics: not significant (ns), ** p<0.01 and *** p<0.001.

