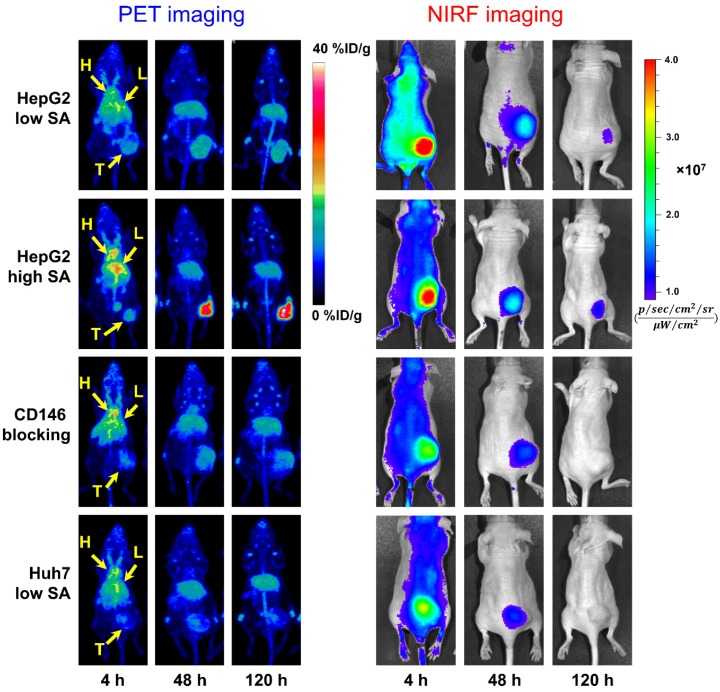
Figure 3.
Longitudinal PET/NIRF imaging study of HCC tumor-bearing athymic nude mice. A) Representative PET MIPs at 4, 48, and 120 h p.i. of 89Zr-Df-YY146-ZW800 with low SA (18.5 GBq/µmol; 400 pmol; first row), high SA (29.6 GBq/µmol; 250 pmol; second row), and high SA plus a pre-injection of YY146 blocking dose (50 mg/kg; third row), in mice implanted HepG2 s.c. xenograft (n = 3-5). Another group of mice bearing CD146-negative Huh7 tumors (bottom row) was injected the high SA tracer (n = 3). Arrows point to the heart (H), liver (L), and tumor (T). B) Sequential NIRF images acquired following PET scans described in (A). All images were acquired under similar conditions, and fluorescence is displayed as radiant efficiency (ηe).

