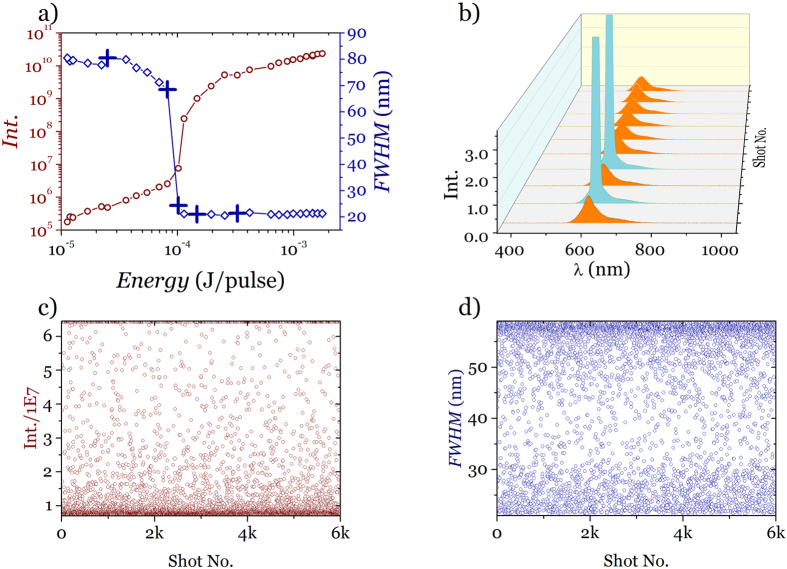
Figure 1. Amplified spontaneous emission and lasing.
(a) Emission intensity maxima versus excitation energy (532 nm, 9 ns. 10 Hz) red open circles (left axis), and FWHM (blue open diamonds) versus pump energy for a dye concentration of 0.04 mg/mL. (b) Series of emission spectra obtained from DCM (dye) 1 mg/1 mL THF in successive excitation shots near threshold (pump energy per pulse 1 mJ). (c) Emission intensity maxima collected for 6000 shots(pump energy per pulse 1 mJ). (d), Corresponding FWHM for each spectrum collected in successive 6000 excitation shots. (pump energy per pulse 1 mJ).

