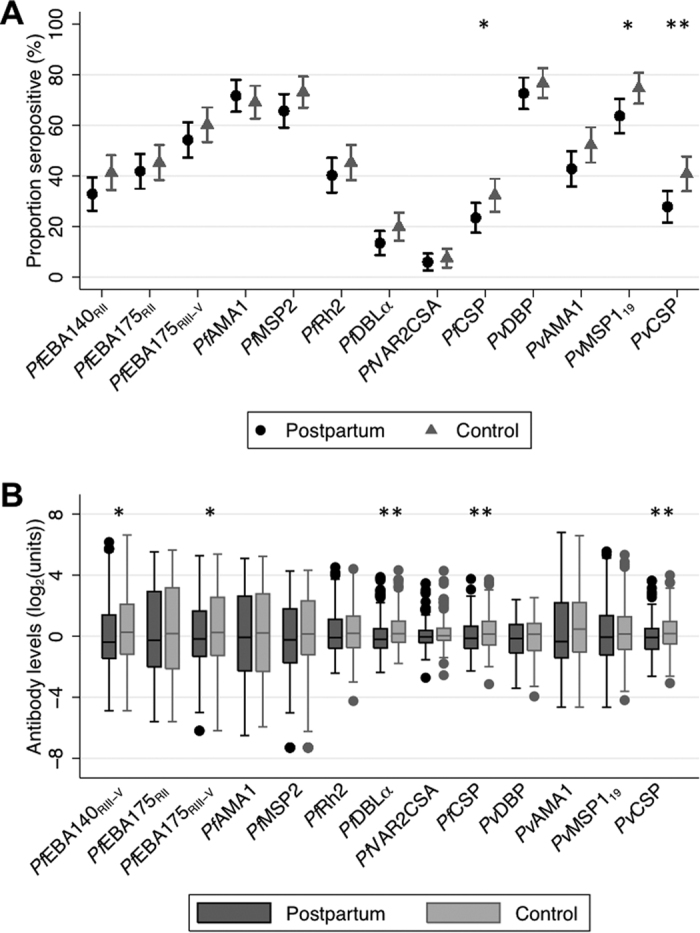
Figure 1. Antibodies to Plasmodium species antigens at baseline.

Antibody levels were determined in all available postpartum women (n = 201) and control women (n = 201) (A) Seroprevalence against P. falciparum and P. vivax amongst postpartum (black circles) and control women (grey triangles). Bars indicate 95% confidence intervals. (B) Box and whiskers plots of IgG levels (log2(MFI) for PfVAR2CSA, log2(OD) for all other antibodies) against P. falciparum and P. vivax antigens amongst postpartum (black) and control (grey) women. Horizontal lines in box indicates median, box indicates the interquartile range, whiskers indicate the highest and lowest values within 1.5*interquartile range of the first and third quartiles, dots represent outliers. A single asterix denotes p < 0.05, a double asterix denotes p < 0.01 from Wilcoxon rank-sum and chi square tests.
