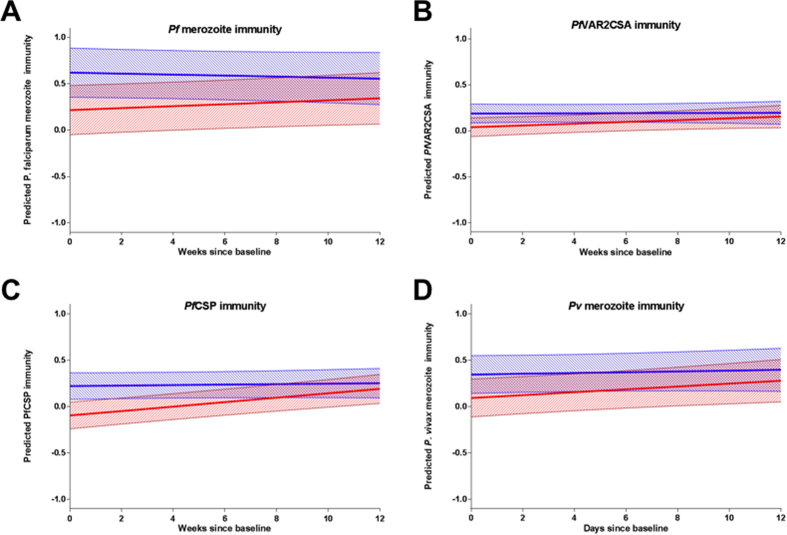
Figure 3. Predicted mean antibody level trajectories over 12 weeks follow-up for postpartum and non-pregnant controls.
Mean predicted values (line) and 95% confidence intervals (shading) of antibody reactivity to (A) Pf merozoite, (B) PfVAR2CSA, (C) PfCSP, (D) Pv merozoite (log2(MFI) for PfVAR2CSA and log2(OD) for all others) are plotted for postpartum (red) and non-pregnant control (blue) women. There was strong evidence for an interaction between postpartum and time for PfCSP antibodies (likelihood-ratio test p value for interaction between postpartum and time) (PfCSP p < 0.001), moderate evidence for Pf merozoite immunity (p = 0.09), weak evidence for Pv merozoite immunity (p = 0.25) and PfVAR2CSA (p = 0.19).

