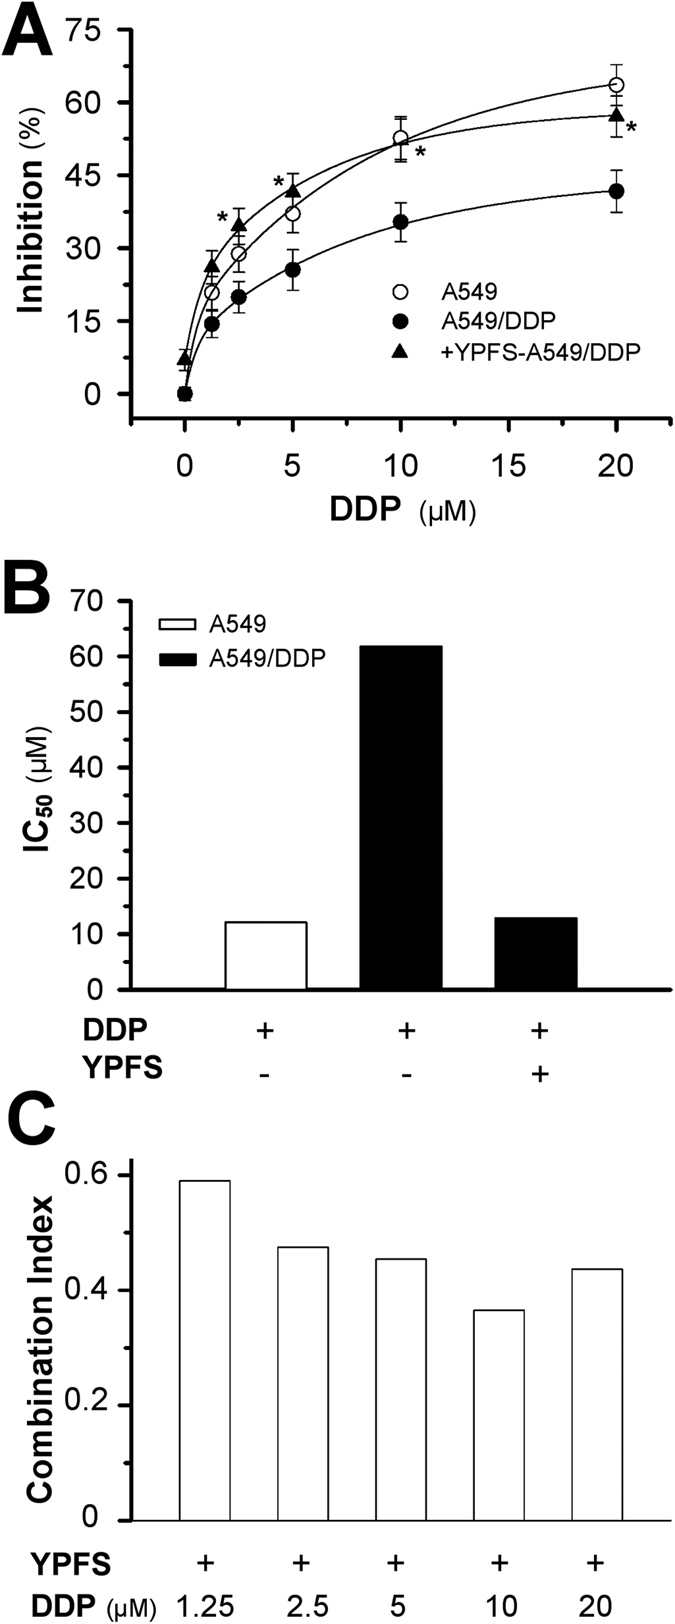
Figure 1. Synergetic effect of YPFS on DDP-induced A549/DDP cell death.

(A) Cells were seeded in 96-well plates (3 × 10³ cells/well) were allowed to adhere overnight and subsequently were treated with increasing concentration of DDP combined with YPFS (1 mg/mL) for 48 hours. Values are in percentage of cell growth inhibition. (B) The IC50 value of DDP on A549 and A549/DDP cells, as well as in the absence and presence of YPFS (1 mg/mL). (C) The Combination Index (CI) was calculated using CompuSyn software. CI values <1, 1 and >1 indicate synergism, additive effect and antagonism, respectively. Each point represents the mean ± SEM, n = 3. *p < 0.05 versus DDP-treated alone on A549/DDP cells.
