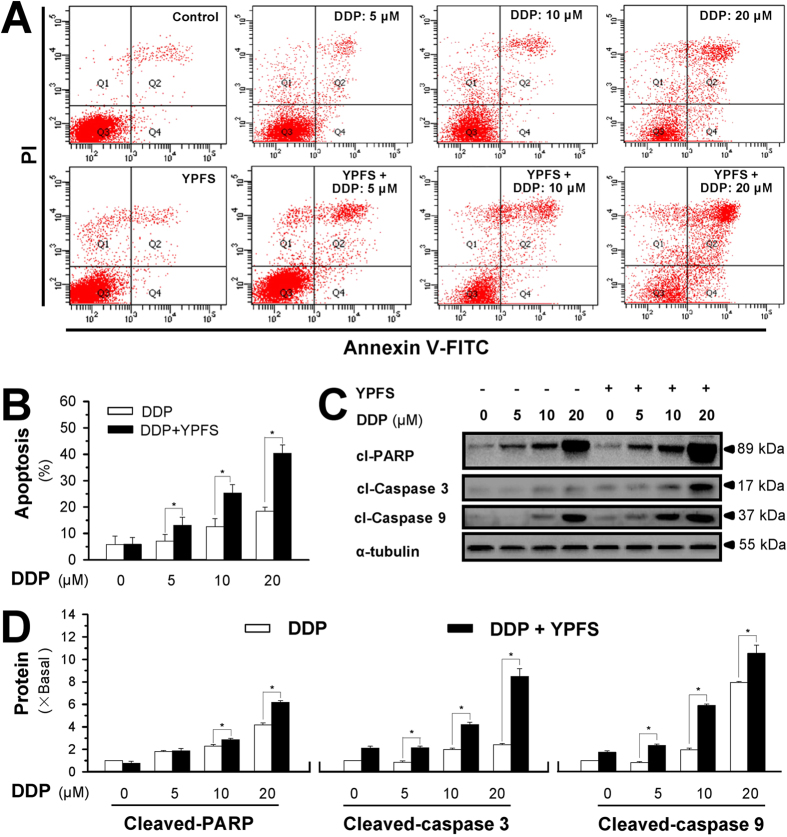
Figure 2. YPFS enhances DDP-induced apoptosis in cultured A549/DDP cells.
(A) Cultured A549/DDP cells were treated with DDP at different doses for 48 hours in the presence or absence of YPFS (1 mg/mL; 12 hours of pre-treatment). Cell apoptosis was detected by flow cytometry with Annexin V/PI apoptosis detection kit. The dual parametric dot plots combining annexin V-FITC and PI fluorescence showed the viable cell population in the bottom left quadrant (Q3), the early apoptotic cells in the bottom right quadrant (Q4), and the late apoptotic cells in the top right quadrant (Q2). (B) Determination of apoptotic rates, as calibrated from (A). Values are in percentage of apoptotic cell number. (C) Western blot analyses of cleaved (cI)-caspase 3 at ~17 kDa, cleaved (cI)-caspase 9 at ~37 kDa, and cleaved (cI)-PARP at ~89 kDa. Expression of α-tubulin (~55 kDa) served as a control. The full length bot of cl-PARP is supplied in supplementary data Fig. 6. (D) Quantitation of cI-caspase 3, cI-caspase 9, and cI-PARP, as calibrated from (C). Values are in fold of change (X Basal) to control (no drug treatment). Each point represents the mean ± SEM, n = 3. *p < 0.05 versus DDP-treated alone.

