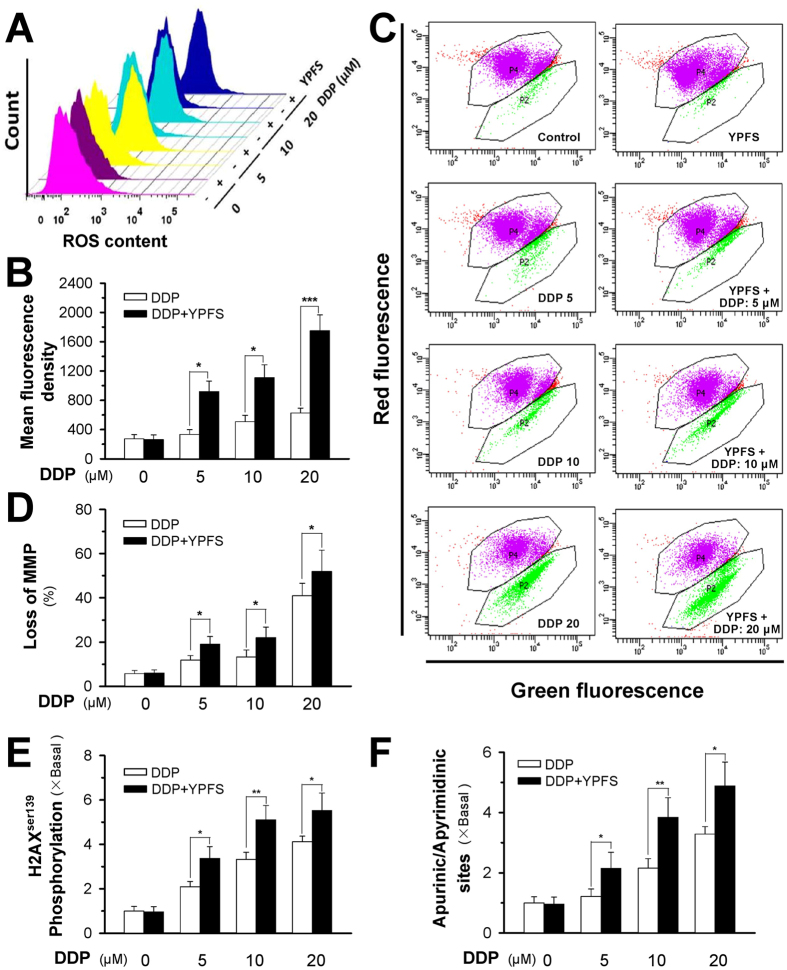
Figure 4. YPFS increases DDP-induced ROS formation, MMP loss and DNA damage in DPP-treated A549/DDP cells.
(A) Cultured A549/DDP cells were treated with or without YPFS (1 mg/mL) for 12 hours, followed by 24 hours of DDP treatment at various concentrations. The amount of ROS was detected by a flow cytometry. (B) Mean fluorescence density of ROS level was calibrated from (A). (C) Cultured A549/DDP cells were treated with or without YPFS (1 mg/mL) as in (A). The MMP was detected by a flow cytometry. (D) The percentage of MMP loss was calibrated from (C). Values are in percentage of MMP loss as compared to control (no drug treatment). (E) Quantification of DNA damage by measuring H2AXSer139 phosphorylation in A549/DDP cells. Cultured A549/DDP cells were treated with or without YPFS (1 mg/mL) for 12 hours, followed by 48 hours of DDP treatment at various concentrations. Values are relative amount in fold of change (X Basal) to control (no drug treatment). (F) DNA damage determined by quantification of apurinic/apyrimidinic sites. The cell treatment was done as in (E). Values are relative amount in fold of change (X Basal) to control (no drug treatment). Results are expressed as the mean ± SEM from three separate experiments, n = 3. *p < 0.05, **p < 0.01, or ***p < 0.001, versus DDP-treated alone.

