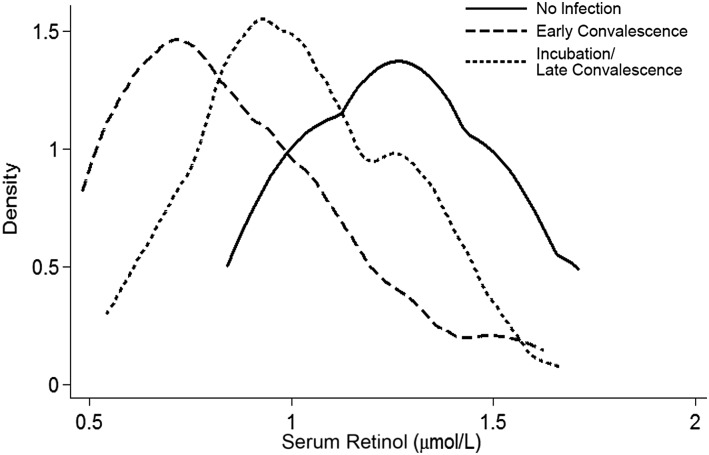
FIGURE 9.
Kernel density estimation visually depicts smoothed distribution trends in serum retinol concentration shifts (μmol/L) by infection stage. The acute-phase response lowers circulating concentrations of retinol. Adapted from reference 220 with permission.

