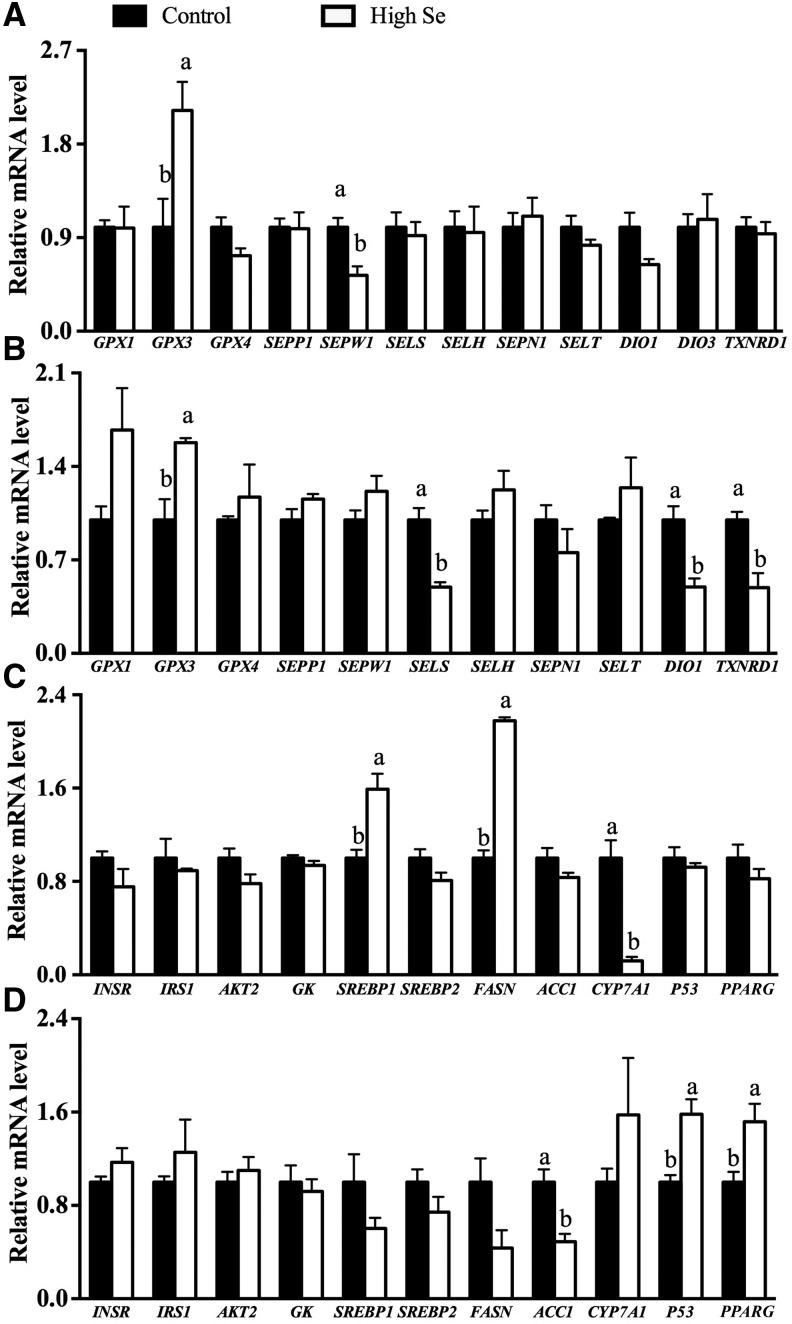
FIGURE 2.
Relative mRNA levels of selenoproteins in the liver (A) and muscle (B) and molecules of insulin signaling, lipid synthesis, and lipid hydrolysis pathways in the liver (C) and muscle (D) of pigs fed 0.3 or 3.0 mg Se/kg for 11 wk (Expt. 2). Values are means ± SEs, n = 6. Means without a common letter differ, P < 0.05. Control = 0.3 mg Se/kg; high Se = 3.0 mg Se/kg. ACC1, acetyl-CoA carboxylase 1; AKT2, v-akt murine thymoma viral oncogene homolog 2; CYP7A1, cytochrome P450, family 7, subfamily A, polypeptide 1; DIO1, deiodinases, iodothyronine, type I; DIO3, deiodinases, iodothyronine, type III; FASN, fatty acid synthase; GK, glucokinase; GPX, glutathione peroxidase; INSR, insulin receptor; IRS1, insulin receptor substrate 1; P53, tumor suppressor protein 53; PPARG, peroxisome proliferator–activated receptor γ; SELH, selenoprotein H; SELS, selenoprotein S; SELT, selenoprotein T; SEPN1, selenoprotein N; SEPP1, selenoprotein P; SEPW1, selenoprotein W; SREBP, sterol regulatory element binding protein; TXNRD1, thioredoxin reductase 1.

