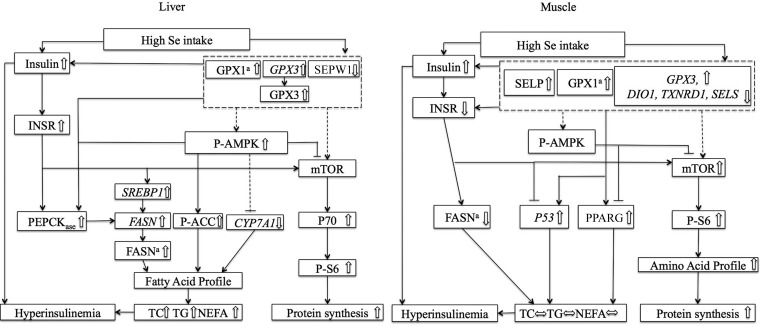
FIGURE 5.
Scheme of postulated regulatory pathways and mechanisms for the effects of feeding a high-selenium diet on lipid and protein metabolism in tissues of pigs. The solid lines represent data-supported pathways, whereas the dashed lines indicate potential, unapproved pathways. CYP7A1, cytochrome P450, family 7, subfamily A, polypeptide 1; DIO1, deiodinases, iodothyronine, type I; FASN, fatty acid synthase; GPX, glutathione peroxidase; INSR, insulin receptor; mTOR, mammalian target of rapamycin; NEFA, nonesterified fatty acid; P53, tumor suppressor protein 53; P70, P70 ribosomal protein S6 kinase; P-ACC, phosphorylated acetyl-CoA carboxylase; P-AMPK, phosphorylated AMP-activated protein kinase; P-S6, phosphorylated ribosomal protein S6; PEPCKase, phosphoenolpyruvate carboxykinase activity; PPARG, peroxisome proliferator–activated receptor γ; SELP, selenoprotein P; SELS, selenoprotein S; SEPW1, selenoprotein W; SREBP1, sterol regulatory element binding protein 1; TC, total cholesterol; TXNRD1, thioredoxin reductase 1.

