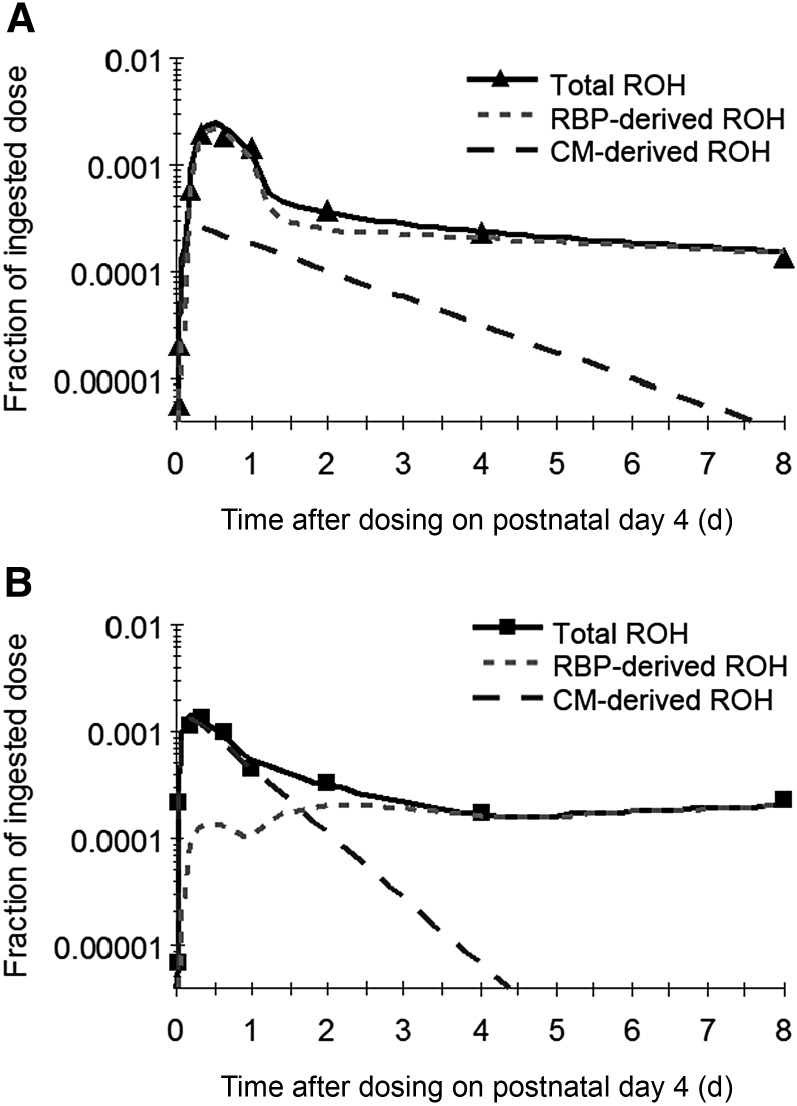
FIGURE 4.
Observed (symbols) and model-predicted (lines) fraction of ingested dose as CM- and RBP-derived ROH as well as their sum (total ROH) in the brain in control (A) and VA-supplemented (B) rats from 0 to 8 d after dosing on postnatal day 4. Each symbol represents the mean of 4 rats. CM, chylomicron; RBP, retinol-binding protein; ROH, retinol; VA, vitamin A.

