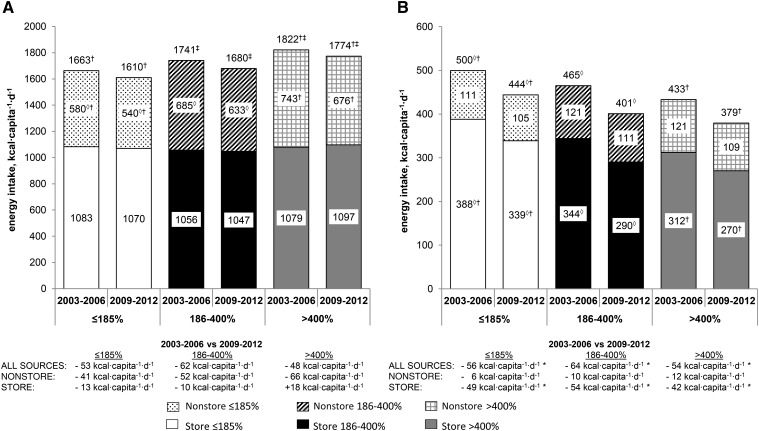
FIGURE 2.
Daily energy intake from stores and nonstore sources of foods (A) and beverages (B) by household income among US children and adults from households with children. Data are from 20,095 children and adults from households with children aged <18 y participating in NHANES 2003–2006 and 2009–2012. Values are mean per capita energy intake from stores and from all nonstore sources (fast food, restaurant food, schools, vending machines, etc.) reported on the first day of 24-h dietary recall. All values are weighted to be nationally representative and account for complex survey design. Income groups were defined based on family income expressed as a percentage of the FPL. ◊,†,‡Mean total energy intake, intake from stores, and intake from nonstore sources were compared across income groups for the specified survey year by using pairwise t tests with P < 0.05 after Bonferroni correction for multiple comparisons considered statistically significant. ◊≤185% FPL and 186–400% FPL are significantly different. †≤185% FPL and >400% FPL are significantly different. ‡186–400% FPL and >400% FPL are significantly different. *Mean total energy intake, intake from stores, or intake from nonstore sources was significantly different in 2009–2012 compared with 2003–2006 for the specified income group, P < 0.05. SEs are found in Supplemental Table 3. FPL, federal poverty level.

