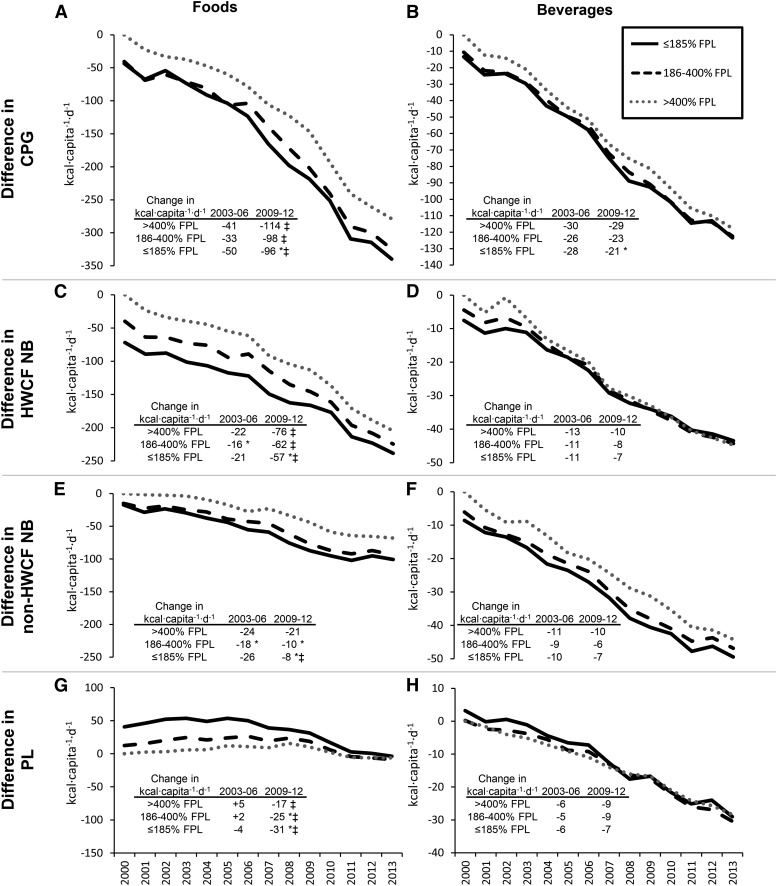
FIGURE 4.
Model-adjusted differences in calories purchased from CPG foods (A), CPG beverages (B), HWCF foods (C), HWCF beverages (D), non-HWCF foods (E), non-HWCF beverages (F), PL foods (G), and PL beverages (H) relative to >400%-FPL households with children in 2000. Model adjusts for household composition, race/ethnicity, income level, educational attainment of the head of household, household head’s employment status, year, market-level unemployment rates, and market-level food prices. Data are from 708,175 household-quarter observations from 64,709 unique households and the University of North Carolina calculation based in part on data reported by Nielsen through its Homescan Services (21) for food and beverage categories in the 2000–2013 periods for the US market. *Assuming linearity, difference in calories purchased compared with >400%-FPL households with children, P < 0.01. ‡Assuming linearity, difference in change in calories purchased compared with 2003–2006, P < 0.01. SEs are found in Supplemental Table 4. CPG, consumer packaged goods; FPL, federal poverty line; HWCF, Healthy Weight Commitment Foundation’s 16 companies; NB, name brand; PL, private label.

