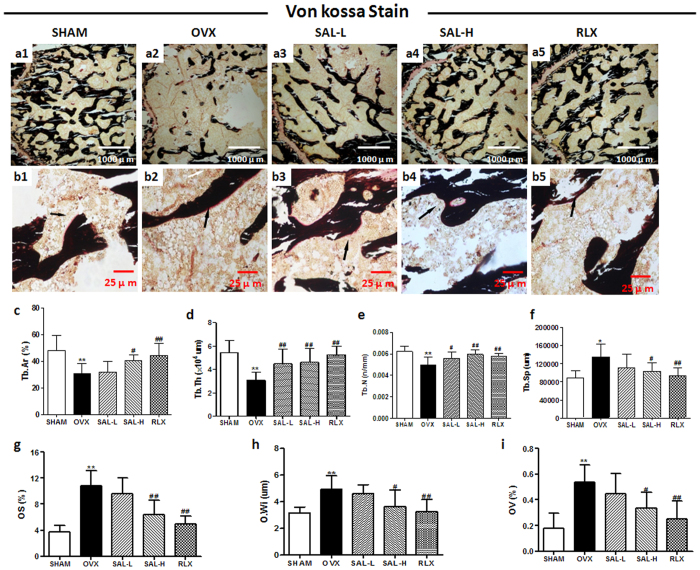
Figure 6. Effects of SAL on the histomorphology of the proximal femur in OVX rats.
Von Kossa staining of femurs (a1–a5:40×; b1–b5:400×). The black arrows show osteoids of the proximal femur. (c) Percent trabecular area (Tb.Ar). (d) Trabecular thickness (Tb.Th). (e) Trabecular separation (Tb.Sp). (f) Trabecular number (Tb.N). (g) Osteoid surfaces (OS). (h) Osteoid width (O.Wi). (i) Osteoid volume (OV).The data are expressed as the means ± SD (n = 9 per group). **P < 0.01 compared with the sham control group; #P < 0.05, ##P < 0.01 compared with the OVX group.

