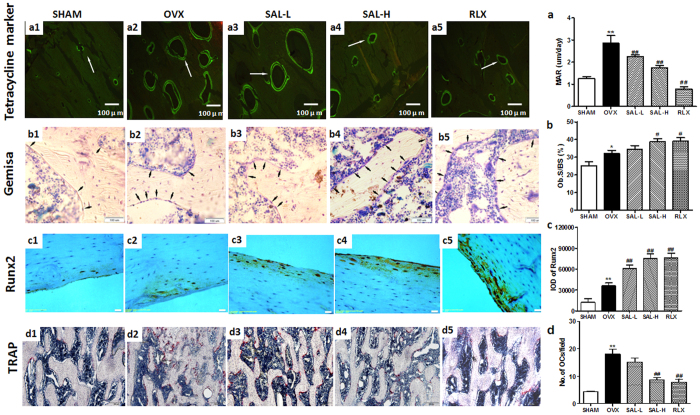
Figure 7. Effects of SAL on the histomorphology of the proximal femur in OVX rats.
(a1–a5, a) Double labelling in the endplate region was used to calculate the mineral apposition rate (MAR) in each femur region (100×). The white arrows show tetracycline double labelling of the femur region. (b1–b5, b) Giemsa staining of the femur was used to calculate the osteoblast absorption surfaces (Ob.S). The black arrows show osteoblasts. (c1–c5, c) Microscopic images of sections stained with immunohistochemisty of Runx2 antibody (200×) and effects of SAL on Runx2 expression in OVX rats. (d1–d5, d) Microscopic images of tartrate-resistant acid phosphatase (TRAP) staining femur section (100×) and the statistical result of number of osteoclasts. The data are expressed as the means ± SD (n = 9 per group). **P < 0.01 compared with the sham control group; #P < 0.05, ##P < 0.01 compared with the OVX group.

