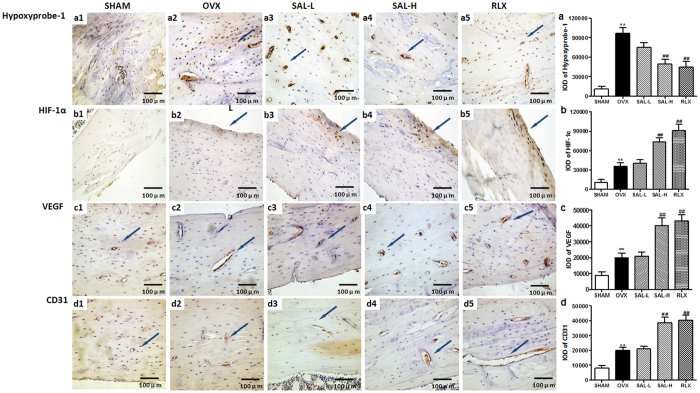
Figure 9. Effects of SAL on Hypoxyprobe-1 staining intensity and HIF-1α, VEGF and CD31 expression in OVX rats.
Representative sections stained with Hypoxyprobe-1 or antibodies against HIF-1α, VEGF and CD31 are shown (the blue arrows, 400×). Quantitative measurements of the staining intensity of Hypoxyprobe-1 (a1–a5, a) and the expression levels of HIF-1α (b1–b5, b), VEGF (c1–c5, c) and CD31 (d1–d5, d) are shown. The data are presented as the means ± SD. **P < 0.01 compared with the sham group; ##P < 0.01 compared with the OVX group.

