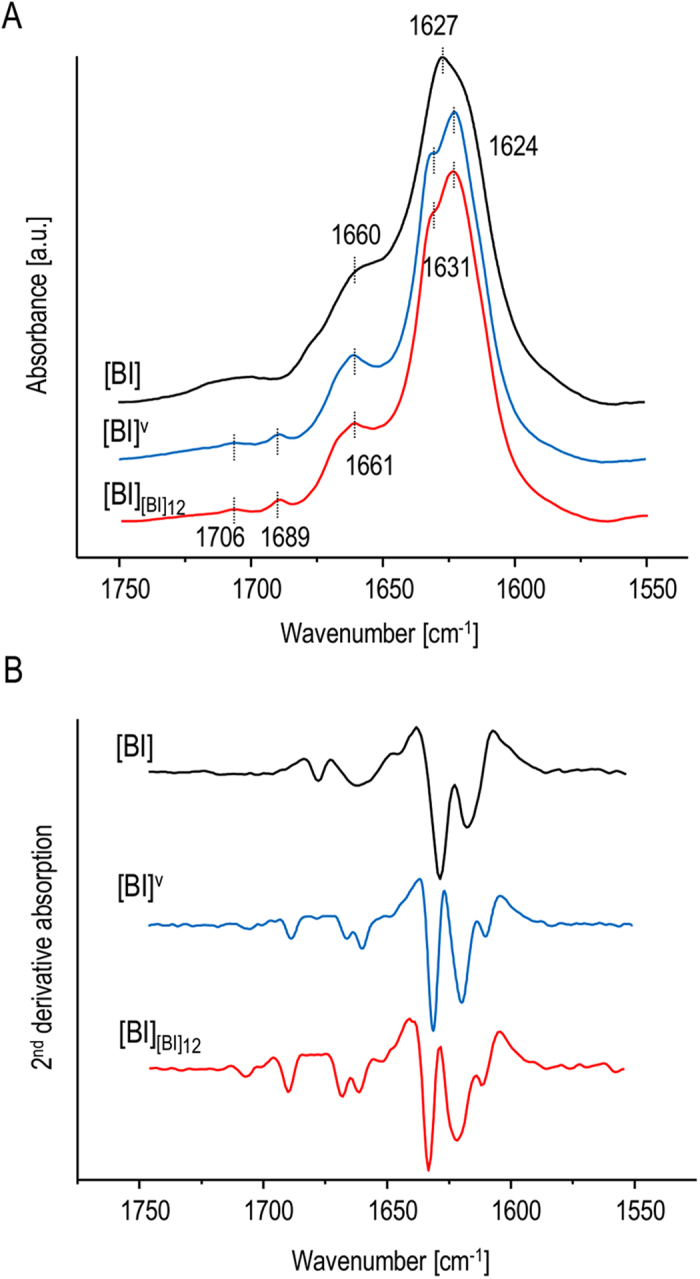
Figure 2. Comparison of FT-IR spectra of various insulin amyloid preparations.

(A) Original absorption and (B) 2nd derivative FT-IR spectra of [BI] fibrils obtained through agitation-assisted (blue) and quiescent (black) aggregation (no seeds added in either case), and of 12th generation of [BI] amyloid induced by the homologous seeding as described in Fig. 1 (red).
