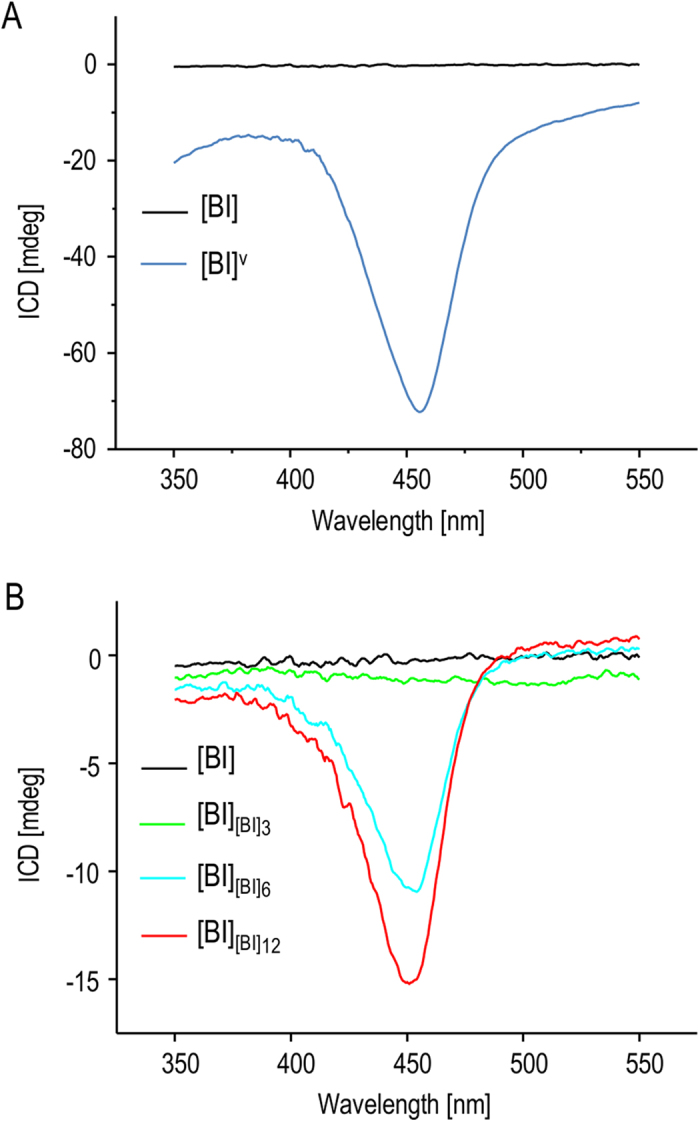
Figure 4. Chiroptical properties of insulin amyloid fibrils.

(A) ICD spectra of ThT-stained [BI] (black) and [BI]V fibrils (blue). (B) ICD spectra of ThT-stained daughter fibrils (0th, 3rd, 6th, and 12th generations) obtained through quiescent aggregation in the presence of seeds at 37 °C.
