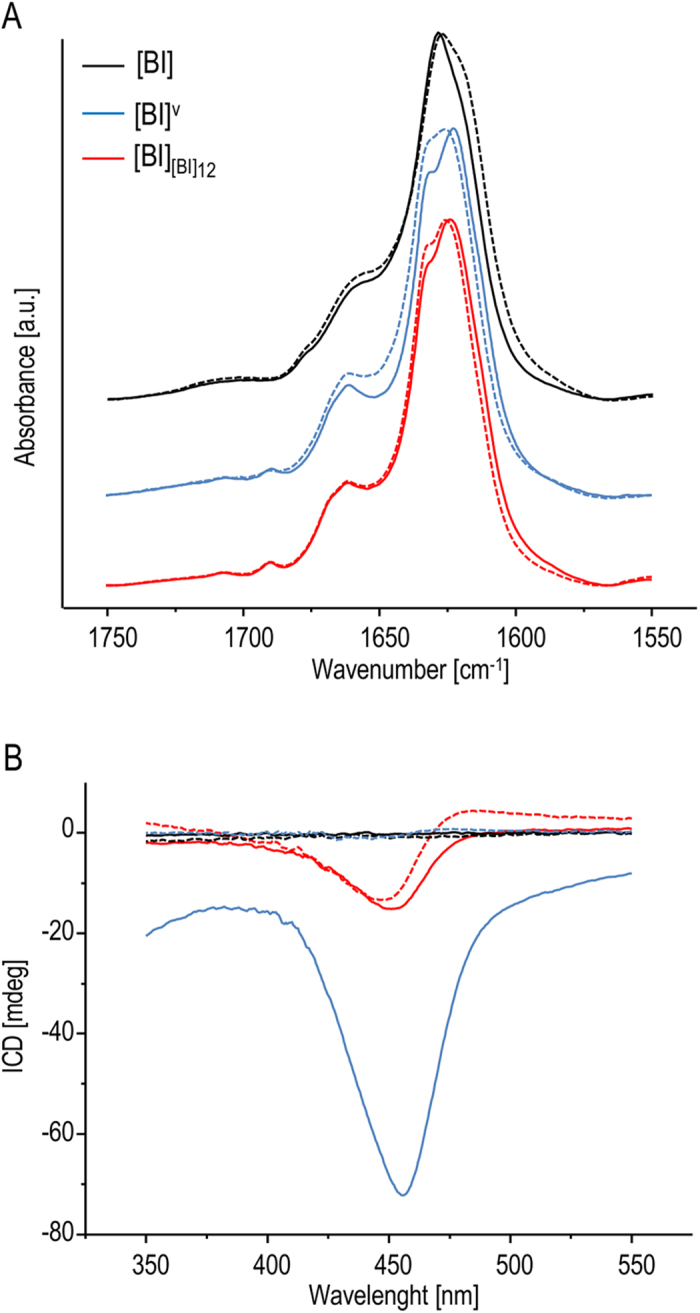
Figure 5. Effects of sonication on various insulin fibrils.

FT-IR (A) and ThT-ICD (B) spectra of insulin fibrils formed spontaneously without seeds and after multiple self-seeding rounds (12th generation of [BI] – red). Solid lines correspond to spectra before sonication whereas dashed lines mark spectra of sonicated samples.
