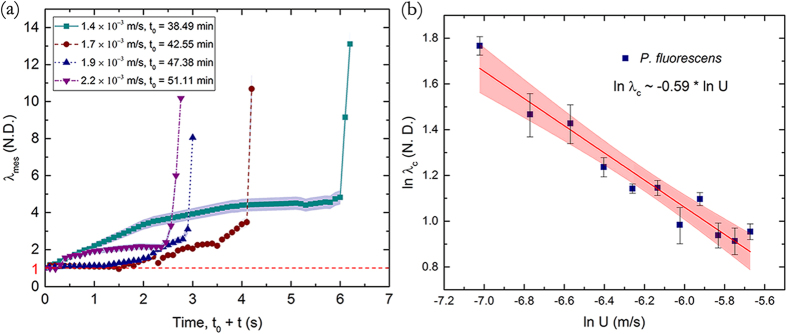
Figure 6.
(a) Stretching of P. fluorescens streamers with time at different background flow velocity scale (U) and t0. Note that the blue shaded region denotes the estimated 4% tracking error envelope applicable for any observed streamer (See Supplementary Information for uncertainty analysis) (b) ln (λc) for different flow rates, shows a linear behavior with ln (U). The blue squares represent experimental data and the red line represents a linear regression fit. The R2 value corresponding to the regression fit is greater than 0.9. The red envelope depicts the 95% confidence interval for linear regression.

