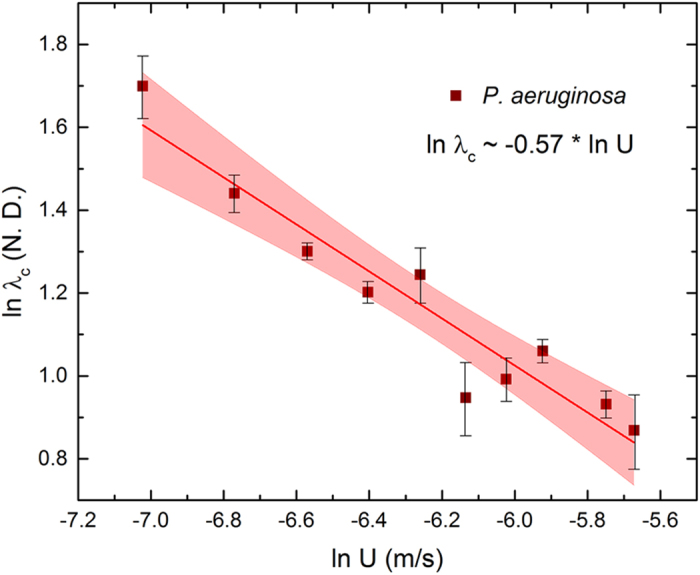
Figure 7. ln (λc) for different flow rates for for P. aeruginosa streamers show a similar scaling with ln (U).

The brown squares represent experimental data and the red line represents a linear regression fit.

The brown squares represent experimental data and the red line represents a linear regression fit.