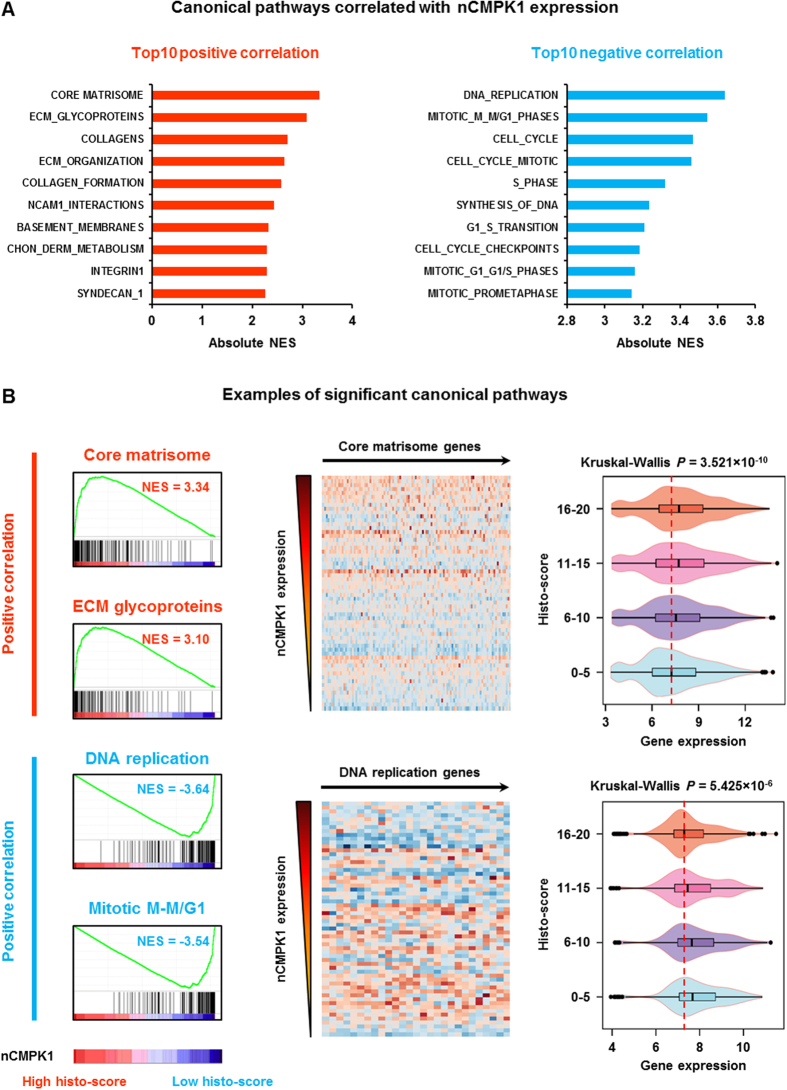
Figure 3. Nuclear CMPK1 (nCMPK1) associated canonical pathways.
Panel A displays the summary of top 10 canonical pathways positively (left panel) and negatively (right panel) correlated to nCMPK1 expression (CHON_DERM_METABOLISM: chondroitin sulfate dermatan sulfate metabolism, NES: normalized enrichment score). Panel B displays examples of the pathways associated with nCMPK1 expression. Left panel: enrichment plots of the most significant pathways; Middle panel: heatmaps of the significant genes in ‘core matrisome’ and ‘DNA replication’ pathways; Right panel: expression of the heatmap genes in 4 groups based on nCMPK1 expression.

