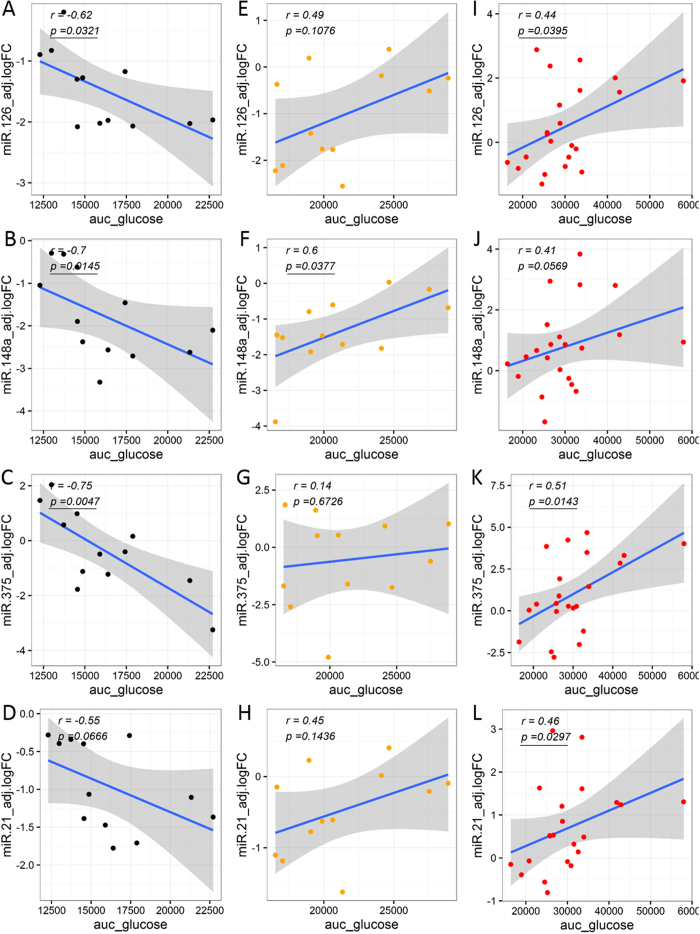
Figure 5. Differential associations between circulating miRNA levels and clinical measure of glycemic control (glucose AUC).
Correlation analyses were performed by calculating partial correlation coefficients between clinical parameters and circulating miRNA logFC levels adjusted for BMI, age, and gender. Left panels (A–D) show correlation plots for the Healthy group (black dots). Middle panels (E–H) show correlation plots for the Prediabetes group (orange dots). Right panels (I–L) show correlation plots for the T2D group (red dots). Blue line represent the linear fit of the plotted points, shown for visualization purposes (gray band represent the associated 95% confidence interval of the fit). Partial correlation coefficient (r) reported in top left corner of each plot. Statistical significance was considered at p-value < 0.05 (bold and underline text in left top corner of plot).

