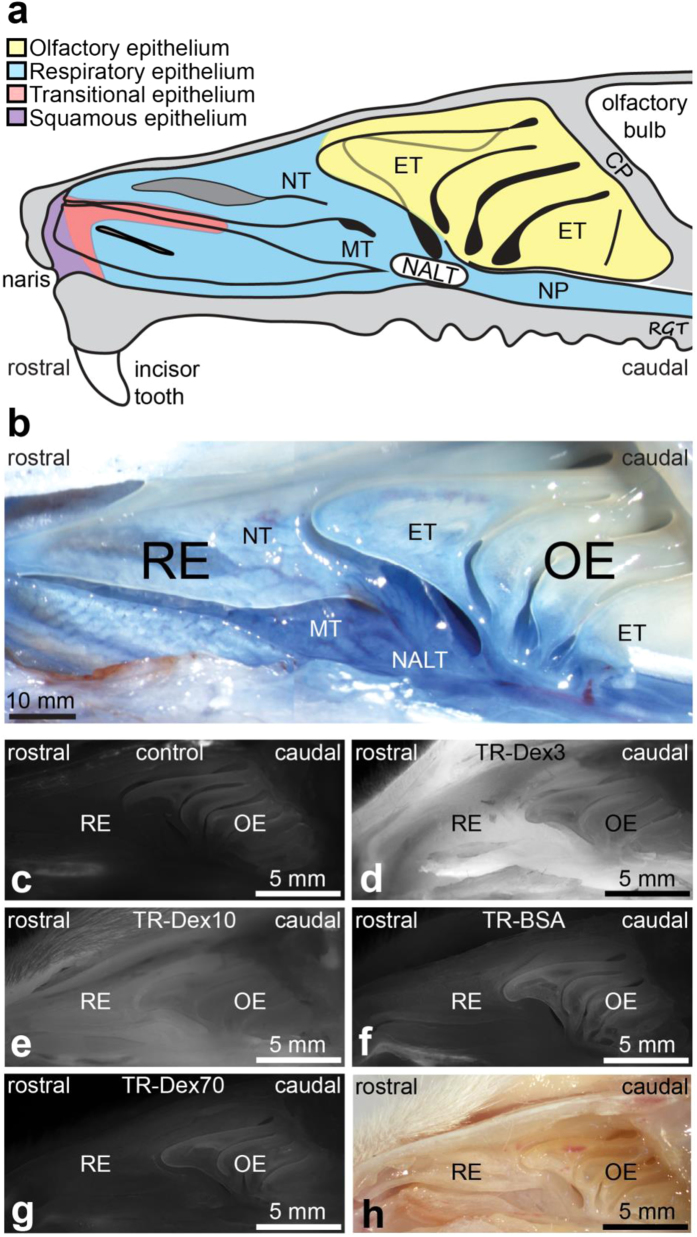
Figure 2. Representative images of the lateral nasal cavity wall demonstrate size-dependent tracer extravasation.
(a) Schematic diagram showing the architecture and epithelial types lining the lateral wall of the rat nasal cavity. Abbreviations: CP, cribriform plate; ET, ethmoturbinate; NT, nasoturbinate; MT, maxilloturbinate; NP, nasopharynx; NALT, Nasal-associated lymphoid tissue (based on Mery et al.33 and Harkema et al.14). (b) Macroscopic aspect of the lateral wall of the rat nasal passage imaged following intra-arterial administration of 2% Evan’s blue (5 ml/kg) (based on a previous study17). Extravasation is noticeably greater within RE regions (NT and MT) and NALT than that observed in OE regions. (c) Representative image of background autofluorescence in the rat nasal cavity following intra-arterial administration of 0.9% saline (control). (d–g) Representative images of fluorescent tracer distribution in the rat nasal cavity following intra-arterial administration of (d) Texas Red-labeled lysine fixable 3 kDa dextran (TR-Dex3), (e) Texas Red-labeled lysine fixable 10 kDa dextran (TR-Dex10), (f) Texas Red-labeled bovine serum albumin (TR-BSA), and (g) Texas Red-labeled lysine fixable 70 kDa dextran (TR-Dex70). A bright field image of the rat nasal cavity is shown in (h) for comparison. Abbreviations: RE - respiratory epithelium; OE - olfactory epithelium.

