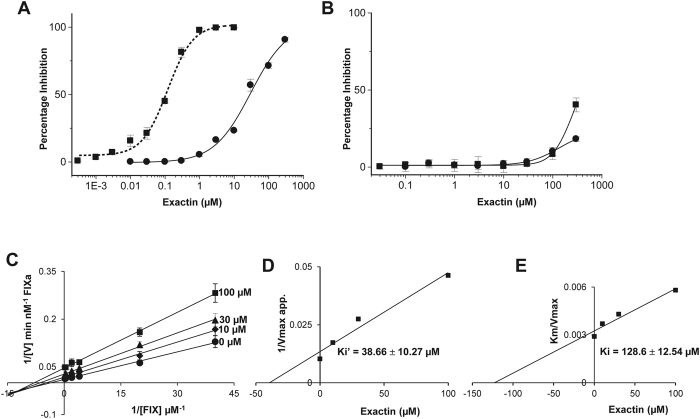
Figure 5. Selective inhibition of FX activation by exactin.
(A) Effect of exactin on the activation of macromolecular substrates FX (■) and FIX (●) by ETC. For comparison, dose-response curve of the effect of exactin on ETC is shown in dotted line. (B) Effect of exactin on amidolytic activity of FXa (■) and FIXa (●). (C) Lineweaver-Burk plot for FIX activation by ETC in the presence of exactin. Both kcat and Km decreased with increase in inhibitor concentration (Table S4), characteristic of mixed-type inhibition. (D,E) Secondary plots depicting Ki’ obtained towards the [ES] complex (FVIIa/TF/FIX/phospholipids) and Ki obtained towards the [E] complex (FVIIa/TF/phospholipids). Each data point represents the average ± SD of three independent experiments.

