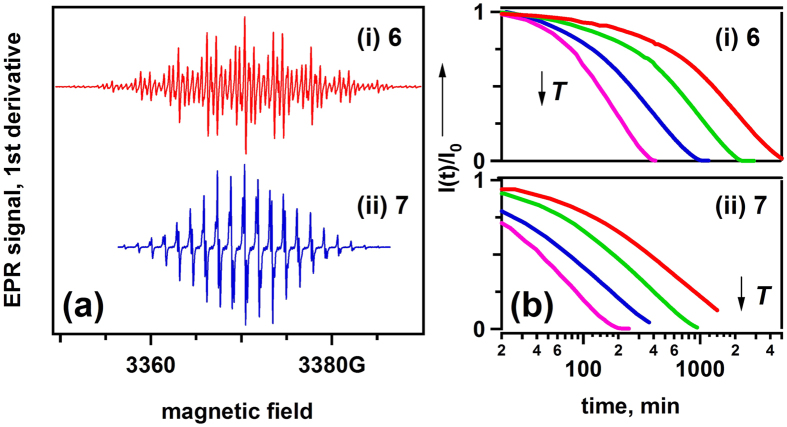
Figure 4. EPR observations of ROMs.
(a) First-derivative continuous wave EPR spectra (1 G = 10−4 T, 0.5 G modulation at 100 kHz) and (b) decay kinetics for the normalized doubly integrated EPR signals I(t) of (i) 6+∙ and (ii) 7+∙ observed in electrochemically oxidized 1 mM solutions. These kinetics were obtained at T = 21.7, 32.5, 41.3 and 57.0 °C. I0 in panel b refers to I(t = 0). Mind the logarithmic time scale.

