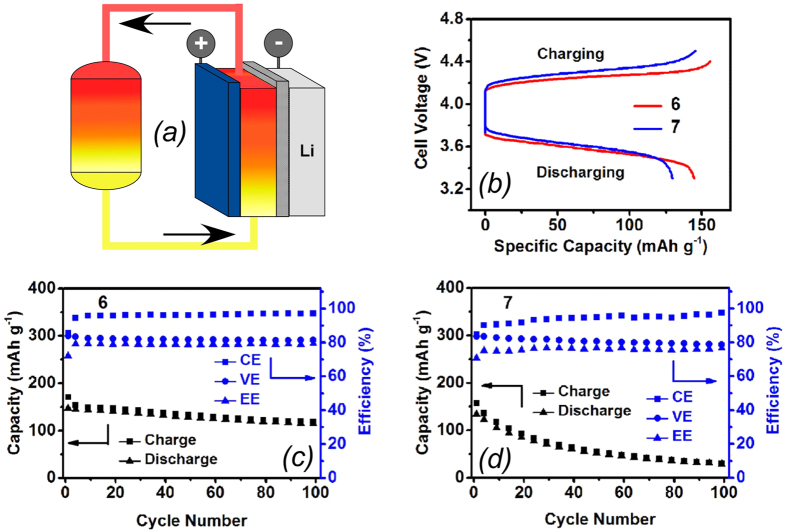
Figure 5. Electrochemical cycling performance tests.
(a) Schematic drawing of redox flow cells with a graphite cathode and a Li-graphite hybrid anode operating at 7.5 mA/cm2. (b) The typical charge/discharge voltage curves for these cells containing 0.1 M 6 (red) and 7 (blue). Cycling efficiencies (in blue, to the right) and specific capacities (in black, to the left) over 100 cycles for (c) Li/6 and (d) Li/7 cells on charge and discharge. CE, VE, and EE are the Coulomb, voltaic, and energy efficiencies.

