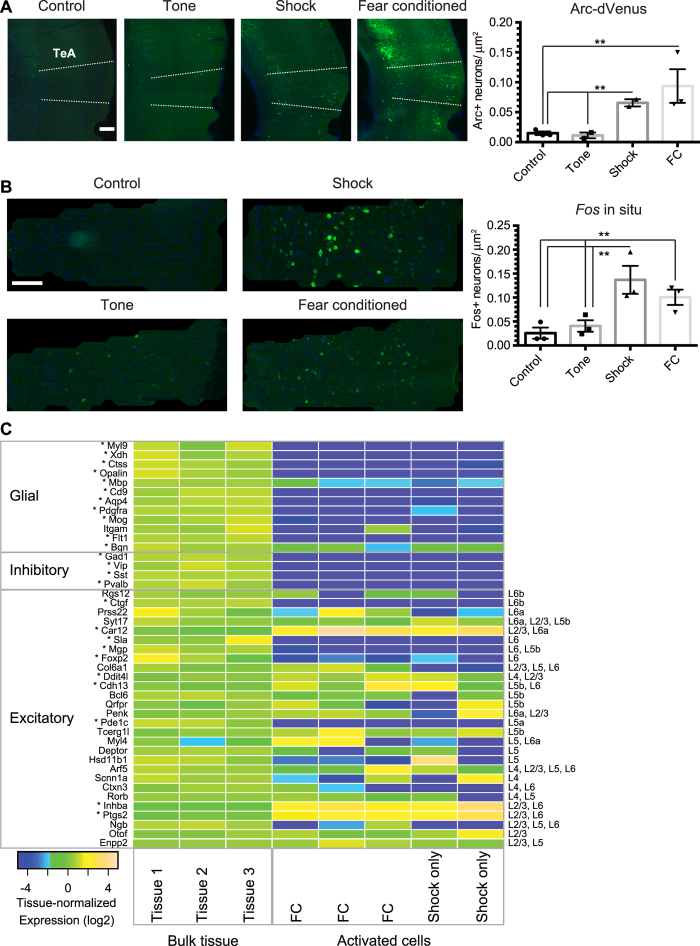
Figure 2. Arc-dVenus+ neurons are enriched for expression of L2/3, L5b, and L6a markers.
(A) Representative images and quantification of Arc-dVenus expression in TeA from control, tone-only, shock-only, and fear-conditioned mice. Scale bar, 200 μm. All values are mean +/− SEM. **p < 0.05, unpaired t-test (two-tailed). Unstarred comparisons are not significantly different. N = 3 mice for control and fear conditioned groups and two mice for the tone-only and shock-only groups. (B) Fos in situ hybridization. Representative cropped images and quantification of Fos expression in TeA from control, tone-only, shock-only, and fear-conditioned mice. N = 3 mice for all groups. Scale bar, 200 μm. All values are means +/− SEM. **p < 0.05, unpaired t-test (two-tailed). (C) Heatmap of expression differences between bulk TeA tissue and sorted Arc-dVenus cells. Glial, inhibitory, and excitatory markers26,46 are indicated at left. Each gene’s expression is normalized to its mean across the three bulk-tissue samples. Within excitatory markers, genes are in rough order of specificity for layer 6 (top) to layer 2 (bottom). Markers for non-neural cells include Aqp4 (astrocytes); Pdgfra (oligodendrocyte precursor cells, OPCs); Mog/Opalin (oligodendrocytes); Ctss/Itgam (microglia); Flt1/Xdh (endothelial cells); and Bgn/Myl9 (smooth muscle cells, SMC). Bulk tissue samples are from FC (Tissue 1), shock (Tissue 2–3) mice respectively. Sorted cells are from FC (23 cells), FC (39 cells), FC (40 cells), shock (30 cells), and shock (33 cells) respectively. *Indicates false discovery rate (FDR) <0.05 from an overdispersed Poisson model.

