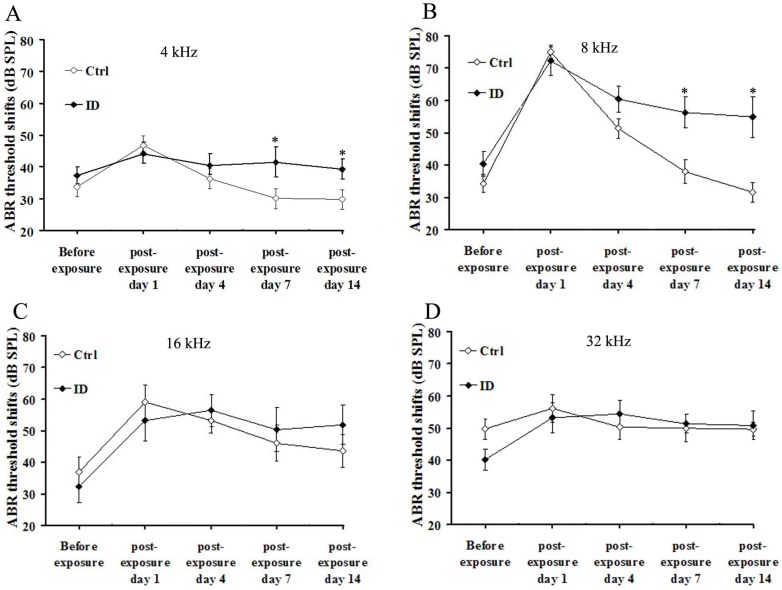
Figure 3.
Hearing test (ABR recording) after noise exposure. ABR threshold shift of young rat between control (n = 8, right ear) and ID group (n = 8, right ear) at: 4 (A); 8 (B); 16 (C); and (D) 32 kHz before noise exposure (on PND 21) and 1, 4, 7 and 14 days after noise exposure. Data are mean ± SEM. * p < 0.05, as compared to control.

