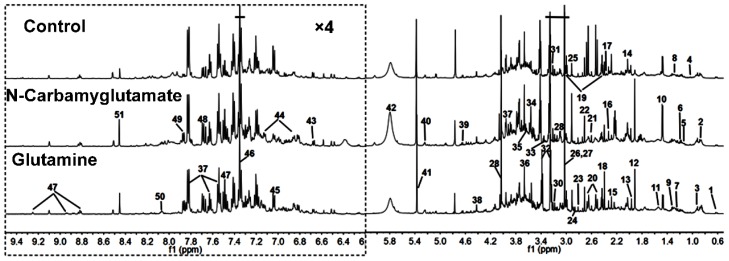
Figure 1.
Representative 1D 1H NMR spectra urine metabolites obtained from the control, N-carbamylglutamate, and glutamine groups. The region of δ6.2–9.5 was magnified four times compared with the corresponding region of δ0.5–6.2 for the purpose of clarity. Metabolite keys are given in Table 1.

