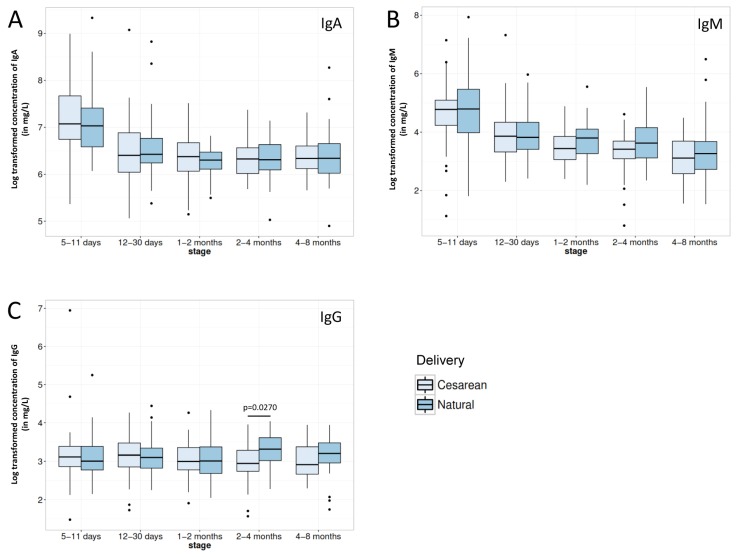
Figure 3.
Comparison of (A) IgA; (B) IgM and (C) IgG immunoglobulin contents in breast milk from mothers delivering their infant either vaginally (Natural) or by Caesarean section for each lactation period of this study. Box plot represent medians with 25th and 75th percentile, min-max range and outliers. Statistical significance was set at p < 0.05 and significant p-values are indicated in the graphs.

