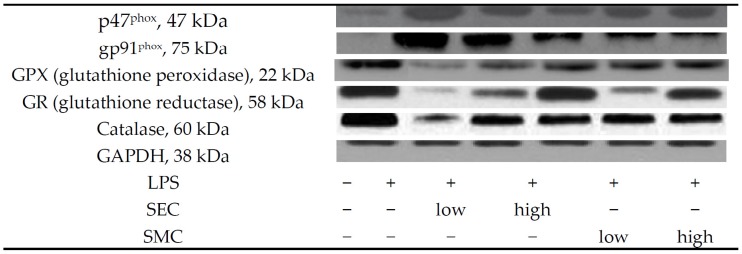
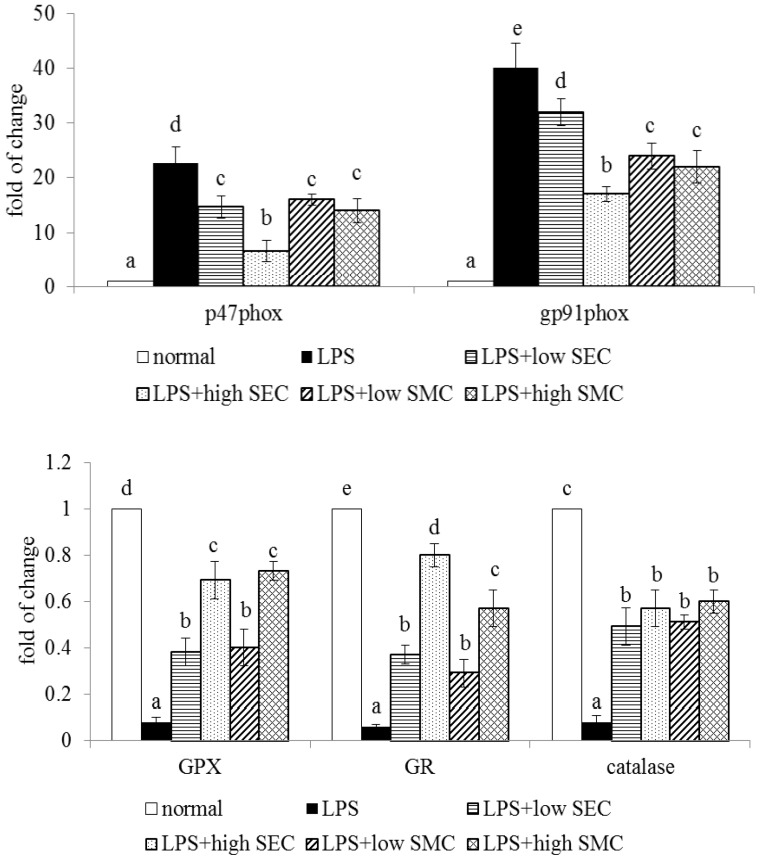
Figure 3.
Lung expression of p47phox, gp91phox, GPX, GR and catalase of mice in normal group, LPS group, LPS + low SEC group, LPS + high SEC group, LPS + low SMC group and LPS + high SMC group after 3-day treatments. Data are mean ± SD, n = 10; a−e Means among bars without a common letter differ, p < 0.05.


