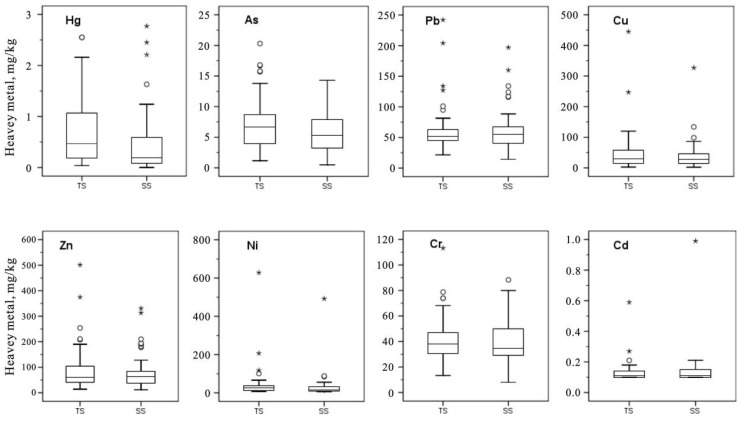
Figure 2.
Heavy metal concentrations of soil from the vicinity of industrial sites in Dongguan. TS: topsoils of 0–20 cm, SS: shallow soils of 20–50 cm. The circle symbols (○) represent outliers (mild outliers), and the cross symbols (*) represent extremes (extreme outliers). The horizontal lines at the top, middle and bottom of the box plot correspond to the 75th percentile, median and 25th percentile, respectively.

