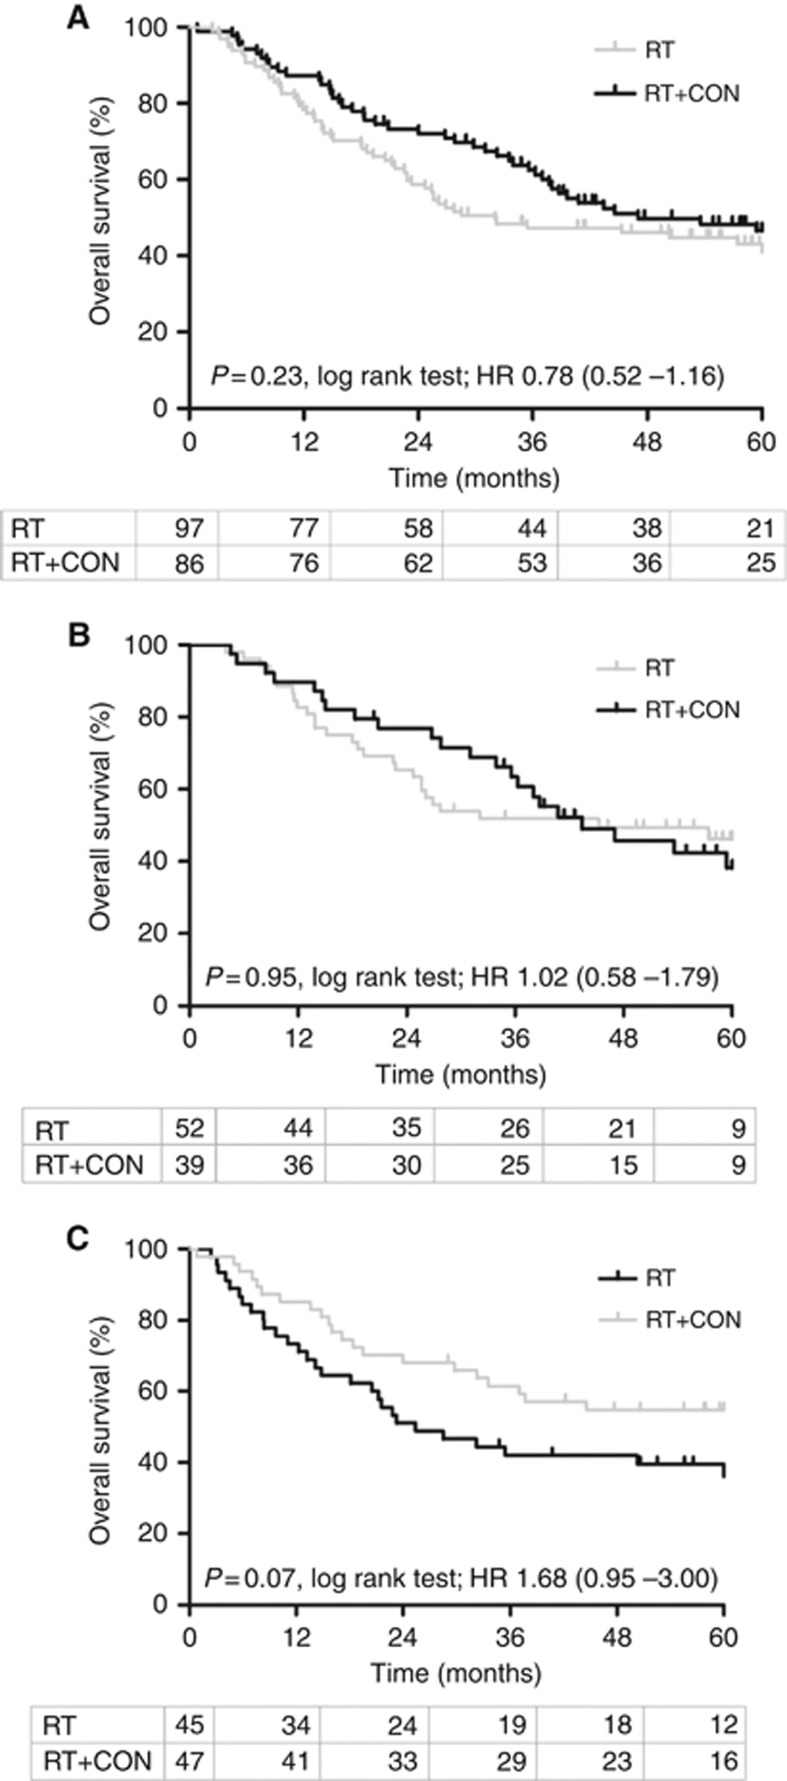
Figure 3.
Kaplan–Meier plots for overall survival after radiotherapy (RT) or radiotherapy plus carbogen and nicotinamide (RT+CON) (A) without further stratification (n=183) and stratified according to (B) low miR-210 or (C) high miR-210 expression. Log-rank P-values, hazard ratios (HR) and number of patients at risk in each yearly interval are also shown.

