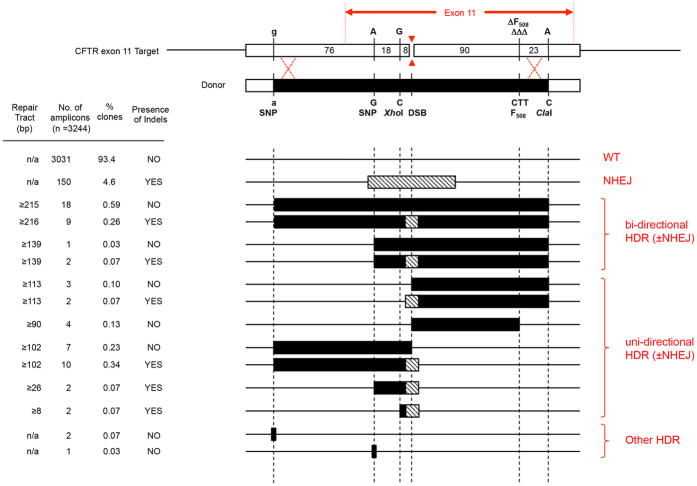
Figure 2. Schematic representation of DNA repair tracts.
The upper panel is a representation of the 216 bp target region of the CFTR gene shown in Fig. 1 which lacks the 3 bp CTT sequence. Underneath is a representation of the 219 bp region of the donor plasmid which shows the approximate position of the seven nucleotides which differ from the target sequence, including the CTT which should repair the F508del mutation. The red arrows indicate the position of the DSB created by the RuvC (top arrow) and HNH (bottom arrow) domains of Cas9. The lower part of the figure shows the different repair tracts observed, tract length, observed frequency and presence or absence of Indels.

