Figure 4.
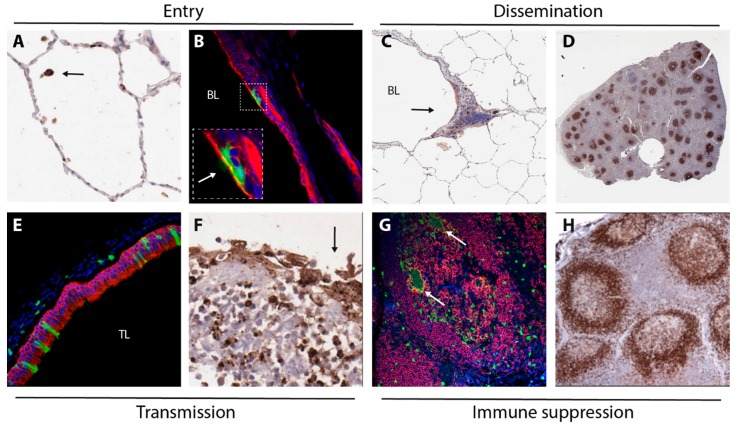
Images collected from experimentally infected NHPs, illustration mechanisms underlying MV entry (A,B), dissemination (C,D), transmission (E,F) and immune suppression (G,H). MV-infected cells were detected by immunohistochemical staining (A,C,D,F) or by immunofluorescent double-staining (B,E,G). (A) infection of a single cell (arrow, likely an alveolar macrophage) in the alveolar lumen 3 DPI; (B) infection of epithelial cells in the trachea 5 DPI (arrow in insert points at green cilia), green = GFP, red = cytokeratin, blue = DAPI; (C) infection of myeloid and lymphoid cells in BALT (arrow) 4 DPI, BL = bronchial lumen; (D) low-magnification image of a lymph node 9 DPI, with many B-cell follicles containing large concentrations of MV-infected lymphocytes; (E) MV-infected epithelial cells in the trachea 9 DPI (green = GFP, red = cytokeratin, blue = DAPI, TL = tracheal lumen); (F) Disruption of the epithelium (arrow) of an adenoid containing many MV-infected lymphocytes 9 DPI; (G) MV-infected B-lymphocytes (including Warthin-Finkeldey syncytia, arrows) in a B-cell follicle 9 DPI (green = GFP, red = CD20, blue = DAPI); (H) follicular exhaustion of B-cell follicles 11 DPI (brown = CD20).

