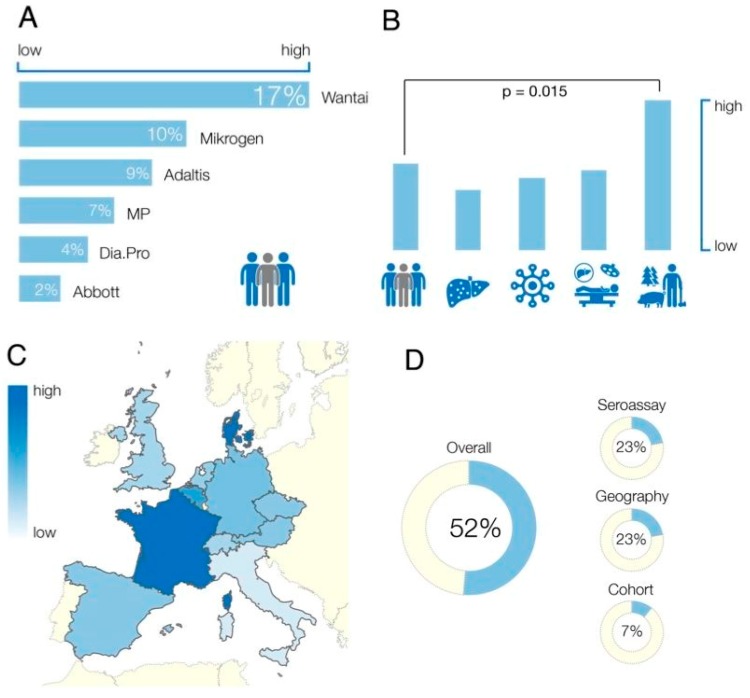
Figure 3.
(A) Anti-HEV IgG seroprevalence rates in the general population dependent on the used seroassay; (B) comparison of estimated seroprevalence rates adjusted for patient cohort. Patient cohorts from left to right: general population, liver diseases, HIV infections, transplant recipients, swine/wild animal contact (farmers, veterinarians, slaughterhouse workers, forestry workers); (C) calculated anti-HEV seroprevalence in different European countries. Exact seroprevalence rates are displayed in Table 3; and (D) amount of heterogeneity explained by used seroassay, study cohort, and geographical location.

