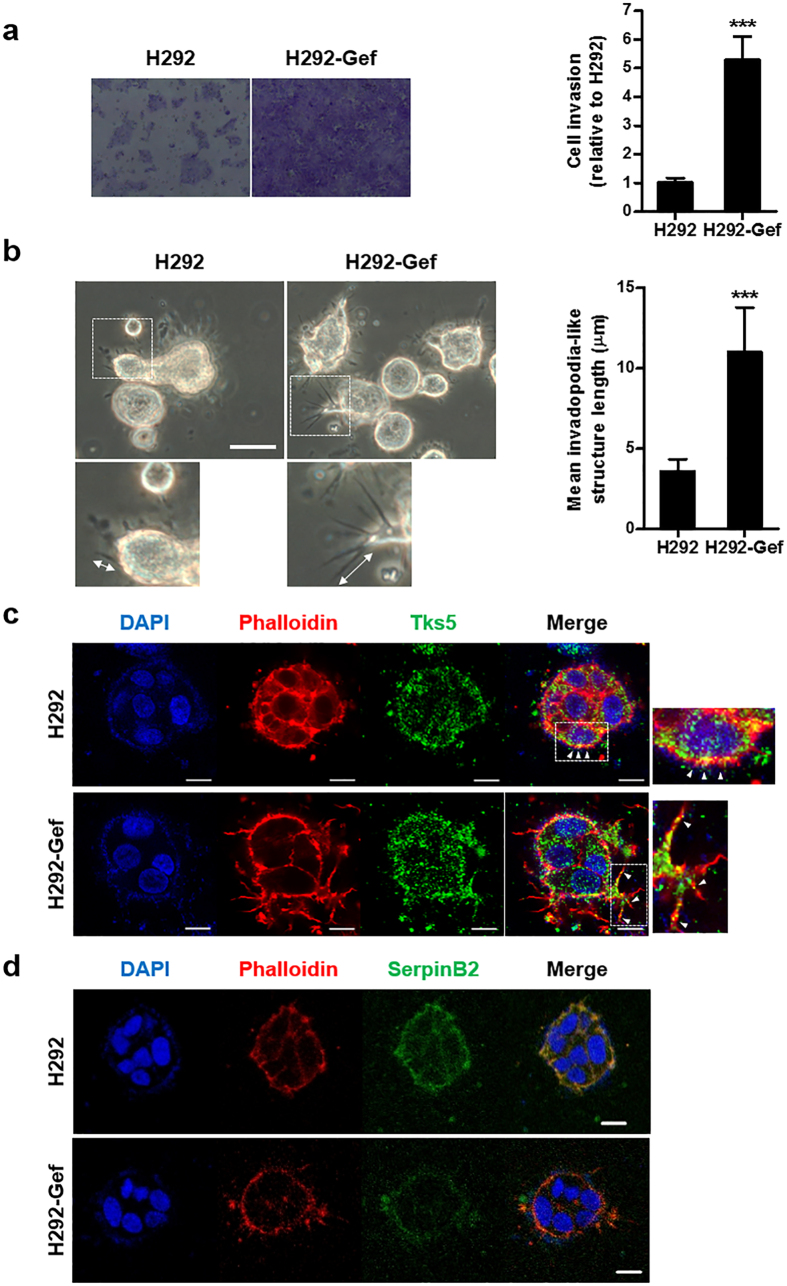
Figure 2. Differences in invasive ability and length of invadopodia-like structures in H292 and H292-Gef cells.
(a) The invasion assay was performed as described in the Methods section. Cells suspended in serum-free medium were added to the upper chambers of Matrigel-coated transwell inserts. The lower chambers contained medium supplemented with 10% FBS. Following a 24-h incubation period, the invaded cells on the lower surface of the membrane were fixed, stained, counted and photographed. Magnification, x100. The data are presented as the mean ± SD. (b) Cells were embedded into 3D collagen I gels and incubated for 2 days. On Day 2, cells were visualized by light microscopy and length of invadopodia-like structures was measured. The data are presented as the mean ± SD. Scale bar, 25 μm. (c,d) 3D-cultured cells were stained with anti-phalloidin, anti-Tks5, anti-SerpinB2 and DAPI for immunocytochemical analysis. Scale bar, 10 μm. Arrows in insets of (c) indicate invadopodia-like structures. *P < 0.05, **P < 0.01, ***P < 0.005.

