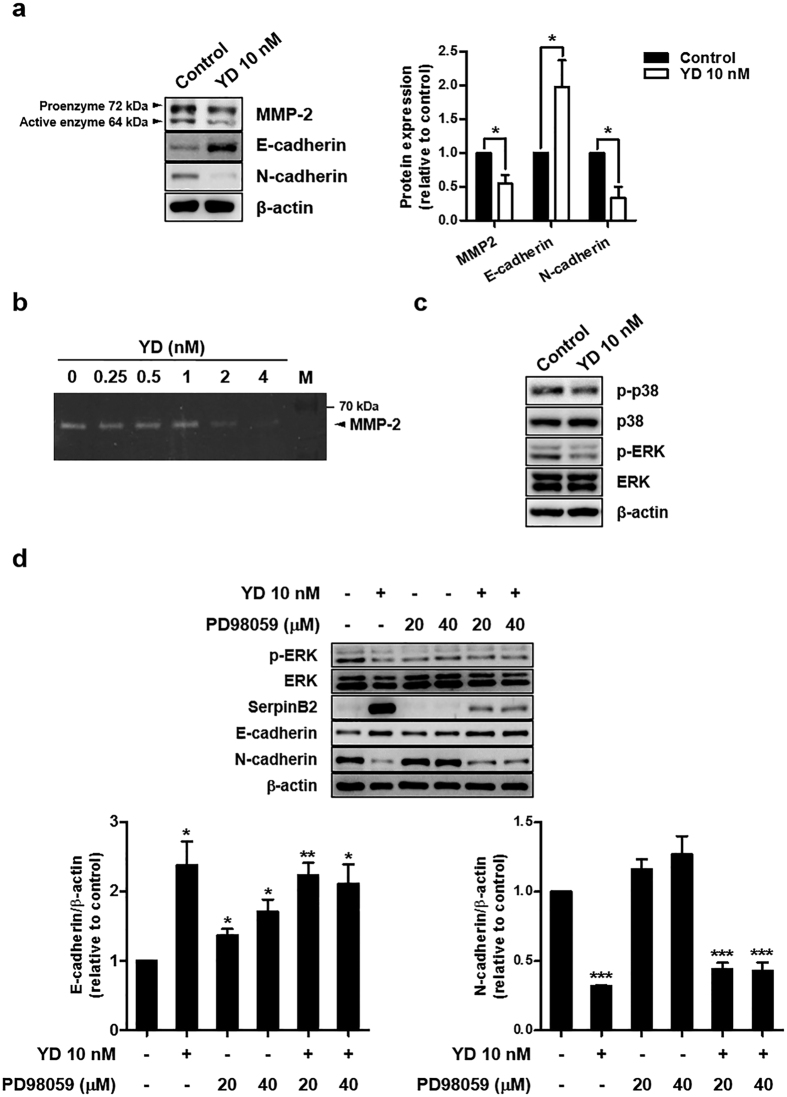
Figure 6. Effects of YD on MMP2, MAPK and cadherins in H292-Gef cells.
(a) H292-Gef cells were treated with 10 nM YD for 24 h. The protein expression levels of MMP2, E-cadherin and N-cadherin were measured by western blot analysis. The levels of MMP2, E-cadherin and N-cadherin were normalized to β-actin levels, and presented as the mean fold changes ± SD relative to control. (b) Gelatin zymography was performed as described in the Methods section. H292-Gef cells were treated with YD for 72 h, and then the proteolytic activity of MMP2 was determined by the degradation of gelatin. M, protein marker. (c) Cells were treated with 10 nM YD for 24 h, and cell lysates were subjected to western blot analysis with indicated antibodies. (d) Cells co-treated with YD (10 nM) and the MEK inhibitor PD98059 (20, 40 μM) for 24 h were subjected to western blotting for indicated proteins. The levels of E-cadherin and N-cadherin were normalized to β-actin levels, and presented as the mean fold changes ± SD relative to control. β-actin was used as a loading control for western blot analysis, and the protein levels were quantified by densitometry using ImageJ. *P < 0.05, **P < 0.01, ***P < 0.005.

