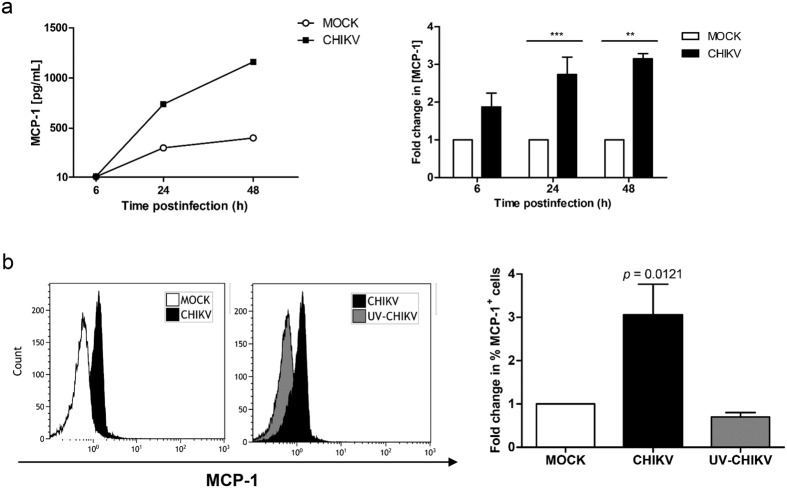
Figure 1. MCP-1 production during CHIKV infection in PBMCs.
(a) Left, time course analysis of MCP-1 levels in supernatant of mock- and CHIKV-infected PBMCs, representative results from one donor. Right, fold change in MCP-1 concentration in the supernatant of CHIKV-infected PBMCs. At least three different donors per time point were analysed, n ≥ 3. Error bars show s.e.m. Two-way ANOVA with Bonferroni’s multiple comparison test was used for statistical analysis. (b) Upregulation of MCP-1 expression at 24 hpi was observed in response to replication competent CHIKV but not to UV-inactivated CHIKV (UV-CHIKV). Bars represent mean fold change over mock-infected cells + s.e.m. One-way ANOVA with Bonferroni’s multiple comparison test was used for statistical analysis. At least three different donors were analysed, n ≥ 3.

