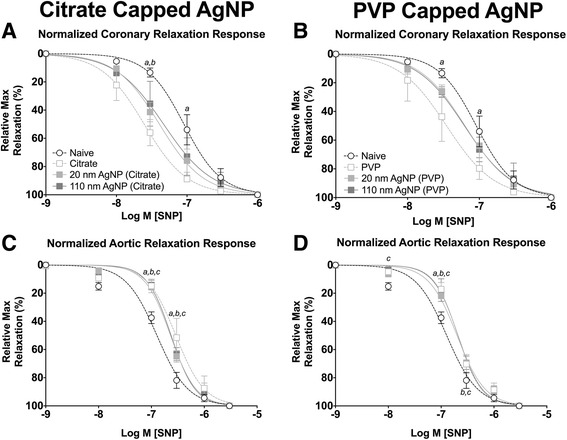
Fig. 10.

Isolated Vessel Myography SNP Responses 7 Days post Exposure. Graphs presenting the normalized stress responses of aorta and coronary artery segments 7 days following IT exposure including: coronary responses to citrate capped AgNP (a) coronary responses to PVP capped AgNP (b) aortic responses to citrate capped AgNP (c) and aortic responses to PVP capped AgNP (d). Statistical significance (p < 0.05) between: naïve and vehicle indicated by (a), naïve and 20 nm AgNP indicated by (b), naïve and 110 nm AgNP indicated by (c), calculated by two-way ANOVA with Tukey post hoc test. Lines represent the nonliner fit to the mean values. Data are reported as mean ± SEM with n = 3–4
