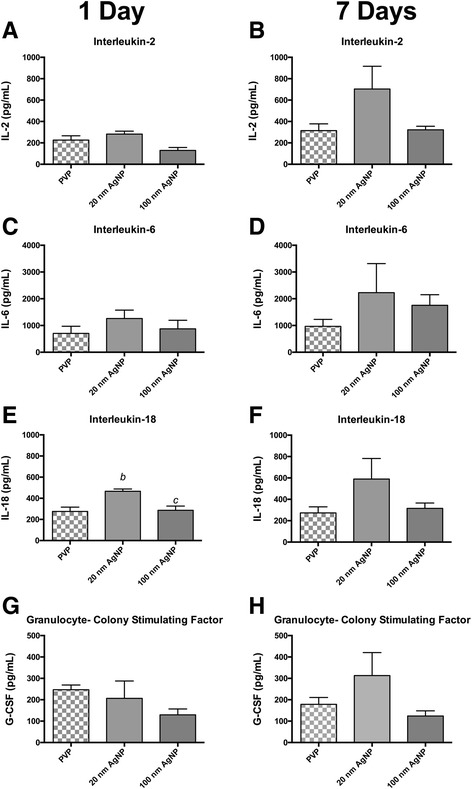
Fig. 2.

Serum Cytokine Concentrations Following IT instillation of PVP Capped AgNP. Graphs presenting mean serum concentration of selected cytokines 1 day (panels a, c, e and g) and 7 days (panels b, d, f and h) after IT instillation. Cytokines IL-2 (a) IL-6 (c) IL-18 (d) and G-CSF (e) were modestly elevated compared to citrate vehicle 1 day following IT instillation. At 7 days following instillation cytokine concentration was not elevated above vehicle. (b) denotes statistical significance from vehicle, (c) denotes significance from other AgNP particle size within a capping agent. p < 0.05 by one-way ANOVA, Data are reported as mean ± SEM with n = 4–8
