
Fig. 4.
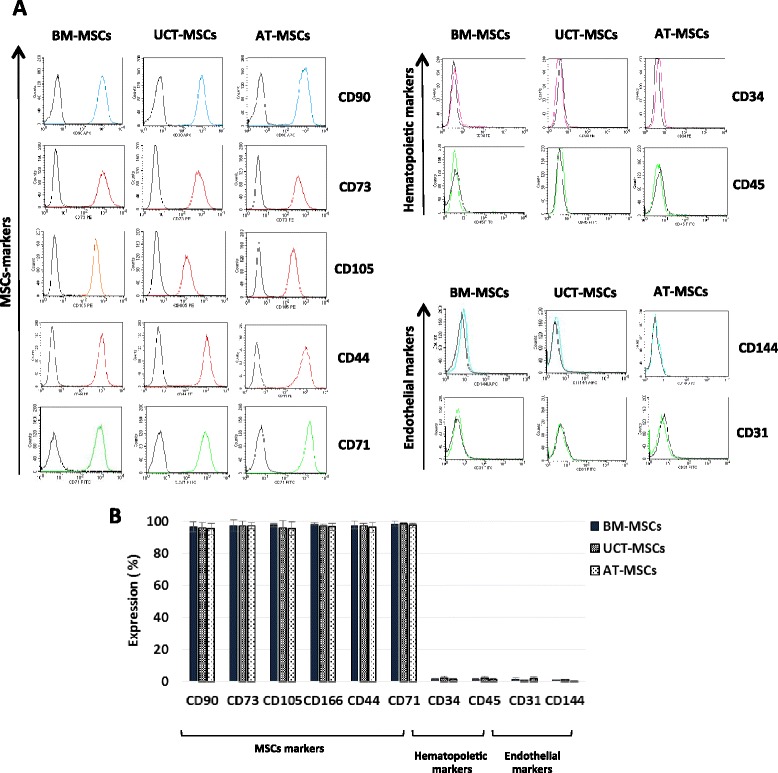
Flow cytometric analysis of MSCs phenotype. a Histograms showing the MSCs, hematopoietic and endothelial surface antigen expression of BM-MSCs, UCT-MSCs and AT-MSCs. One representative MSC sample for each source is shown. b Quantitative expression of MSCs, hematopoietic and endothelial antigens measured by flow cytometry. Results are expressed as mean ± SD (standard deviation) of ten samples processed for each tissue. AT adipose tissue, BM bone marrow, MSCs mesenchymal stromal cells, UCT umbilical cord tissue