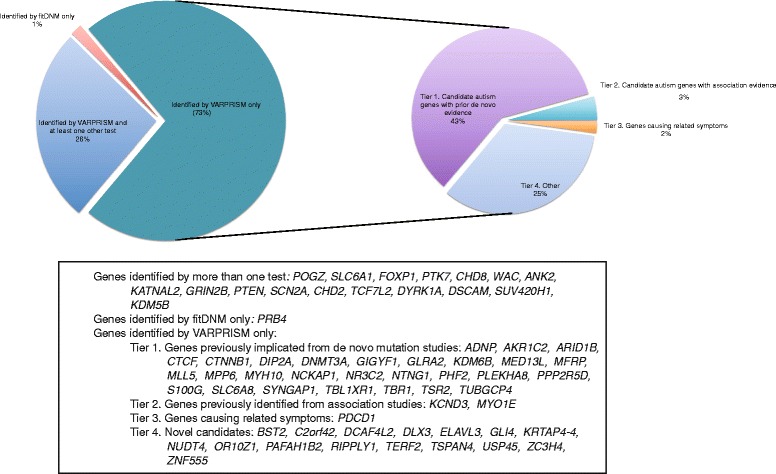
Fig. 2.

Candidate de novo mutated genes identified by VARPRISM, Poisson tests, and fitDNM. Left, the pie chart shows the relative proportion of genes found by VARPRISM and any other tests (Poisson-all, Poisson-LGD, or fitDNM). Right, the pie chart further illustrates the level of evidence for genes found by VARPRISM only. Gene names in each category were listed below
