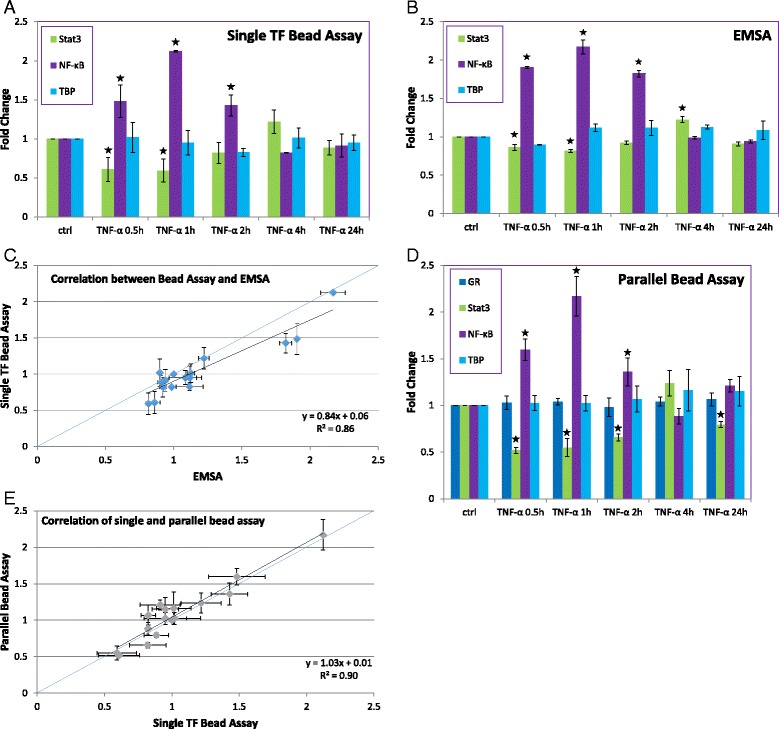
Fig. 1.

Quantification of TF levels in nuclear extracts of MDA-MB-231 cells after TNF-α stimulation. a Single TF detection by bead assay. The percentage of radiolabeled TF probe remaining on the beads (relative to signal that did not bind or was washed from the beads) was calculated. Fold changes relative to control are shown. (n = 3, * indicates p < 0.05). b Single TF detection by EMSA. The fractions of bound and unbound DNA probe were quantified, and the fraction of bound signal was calculated relative to the total signal from the lane. Fold changes relative to control are shown. (n = 3, * indicates p < 0.05). c Correlation between detection by bead assay and EMSA. The 1:1 line (blue) is included for reference. d Parallel TF detection by bead assay. Signals were normalized with respect to an internal standard and then the ratio with respect to control was calculated. (n = 3, * indicates p < 0.05). e Correlation of single and parallel bead assay measurements. The 1:1 line (blue) is included for reference
