
Fig. 5.
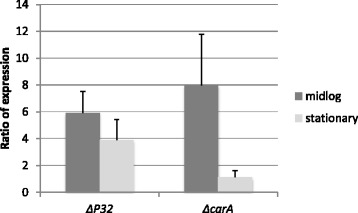
Expression of P32 and carA in wild-type DC3000 compared to ΔargR mutant using qRT-PCR. The dark gray bars represent the ratios of the transcripts comparing ΔargR mutant to the WT at mid-log phase, and the light gray bars represent the ratios of the transcripts comparing ΔargR mutant to the WT at stationary phase. RNA samples were normalized using gap1. The ΔargR mutant shows increased levels of P32 and carA transcript compared to the WT at mid-log phase. The levels of P32 and carA transcripts were analyzed by calculating the fold difference of transcript levels between WT and ΔargR mutant using the Δ Ct method. Data shown are the average and standard deviation of three independent biological replicates