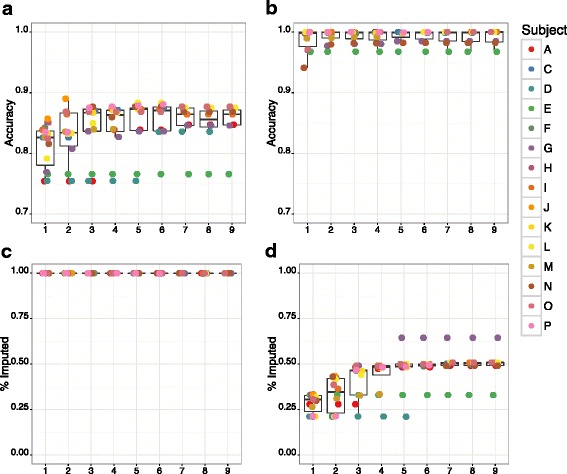
Fig. 4.

Imputation accuracy on chromosome 19 by total number of individuals selected for WGS. Accuracy for an optimal set of dense markers on chromosome 19, using 1–9 individuals with WGS data, imputed into all remaining pedigree members with GBS data, using the “Most Likely” genotype calling method (A, C) or by assigning genotypes based on hard probability thresholds (“Threshold”) (B, D). Circles denote individual animals as indicated in the legend; we note that not every individual may be distinguished in these graphs due to overlapping values. Individuals with WGS data were ranked by the GIGI-Pick algorithm [14] and used for imputation in the following order: B, H, J, F, M, K, P, C, D (see Fig. 1)
